


Featured News Headlines
ZEC Price Rally: Spot Accumulation and Futures Surge Point to Bullish Momentum
After years of tight consolidation, Zcash (ZEC) has finally escaped its prolonged trading range, reaching a new local high of $744. Since touching that level three days ago, the privacy-focused cryptocurrency has shown intense volatility — rising above $700, plunging to $488, and later rebounding above $600.
At the time of writing, ZEC was trading around $574.92, marking a 4.42% decline in the past 24 hours.
Futures Data Highlights Strong Buyer Activity
Zcash’s rebound over the past month has been matched by a sharp rise in Futures market participation. Data indicates that the Futures Taker Cumulative Volume Delta (CVD) remained positive throughout the last 30 days — a sign of buy-side dominance.
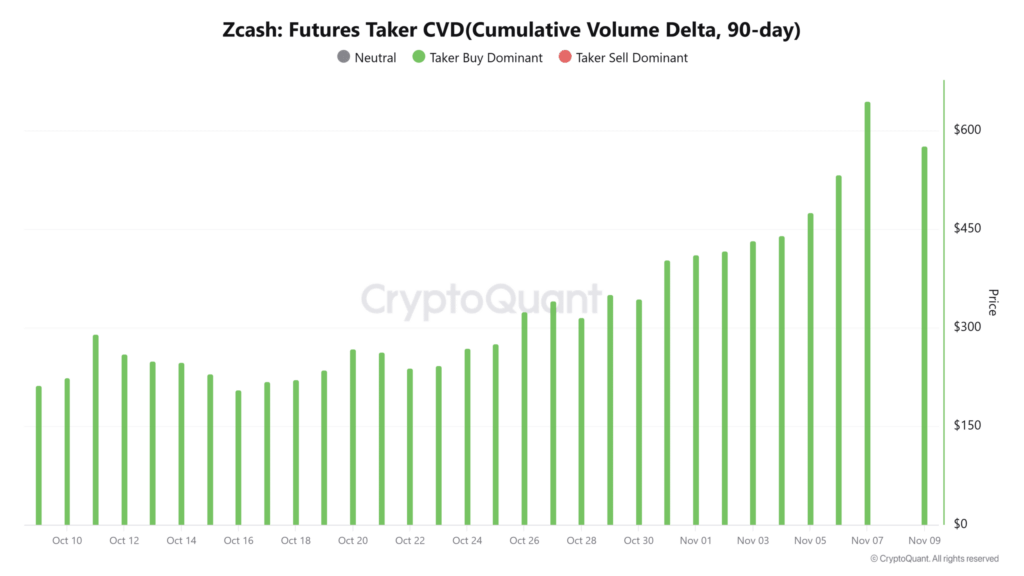
This trend reflects a market environment where traders are strategically entering both short and long positions, with a noticeable preference for the bullish side.


According to on-chain analytics platform Lookonchain, one major investor — described as a whale — “bought the dip after ZEC dropped to $509.” The same report revealed that the whale deposited $6.27 million into Hyperliquid and placed a limit-long order for 20,800 ZEC worth approximately $12.12 million.
As prices rose, this position reportedly generated an unrealized profit of $1.51 million, before the trader eventually closed it with a realized gain of $1.25 million.
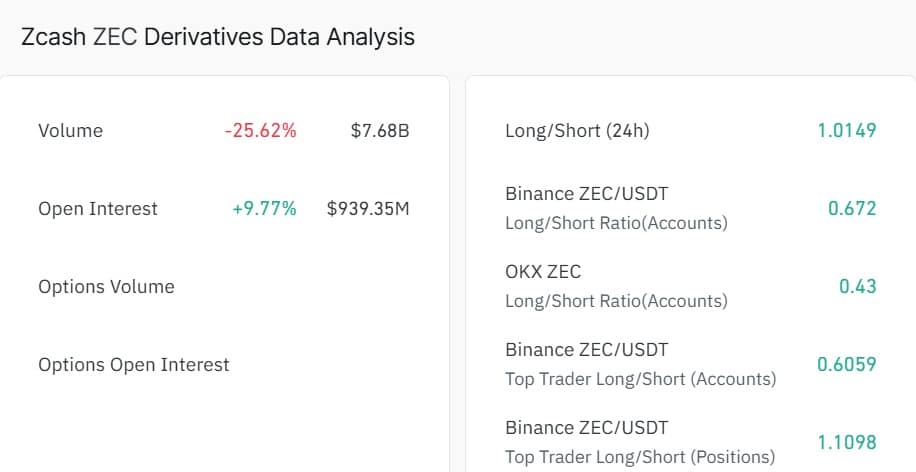
Open Interest and Long/Short Ratios Support Bullish Sentiment
According to CoinGlass, Zcash Open Interest increased by 9.77%, reaching $939.31 million, suggesting strong capital inflows into the futures market.
Additionally, Long/Short Ratio data across major exchanges reinforced this bullish tilt.
CoinGlass reported a 24-hour global Long/Short Ratio of 1.0149, while Binance Top Traders’ Positions stood at 1.1098, showing a steady increase in long exposure among experienced traders.
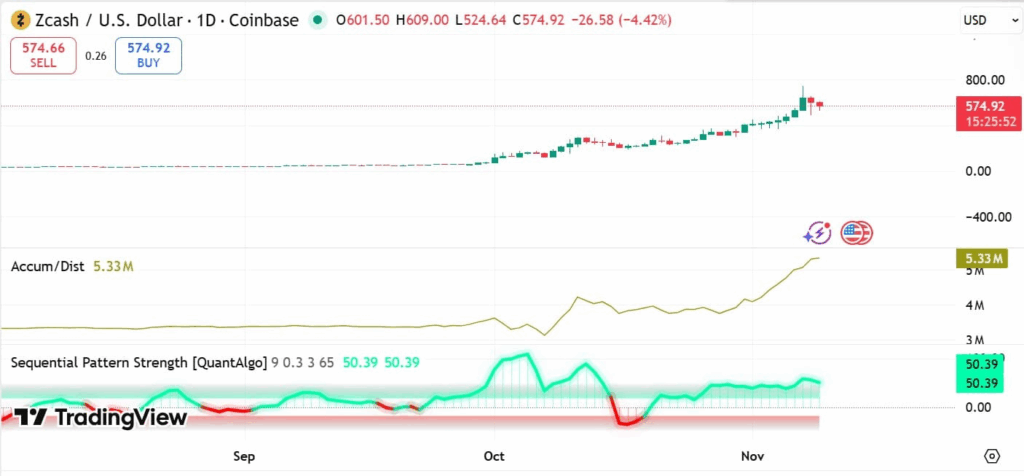
Spot Market Accumulation Strengthens the Bull Case
Beyond derivatives, on-chain data shows a growing trend of spot accumulation among investors.
The Accumulation/Distribution (A/D) Line has climbed steadily to 5.33 million, reflecting consistent buying pressure. Notably, significant volumes have been added near daily highs — a signal often linked to institutional or whale activity.
Moreover, the Sequential Pattern Strength indicator has remained positive for three consecutive weeks, implying that recent price gains are being driven by genuine demand rather than short-term speculation.
If current trends persist, analysts suggest that ZEC could retest the $698 resistance and possibly move toward $803. However, the high level of leveraged positions in the market introduces potential risks — any wave of liquidations could push prices back toward the $480 zone before establishing a new support base.


Comments are closed.