


Featured News Headlines
Weekly and Monthly Charts Tell a Different Story
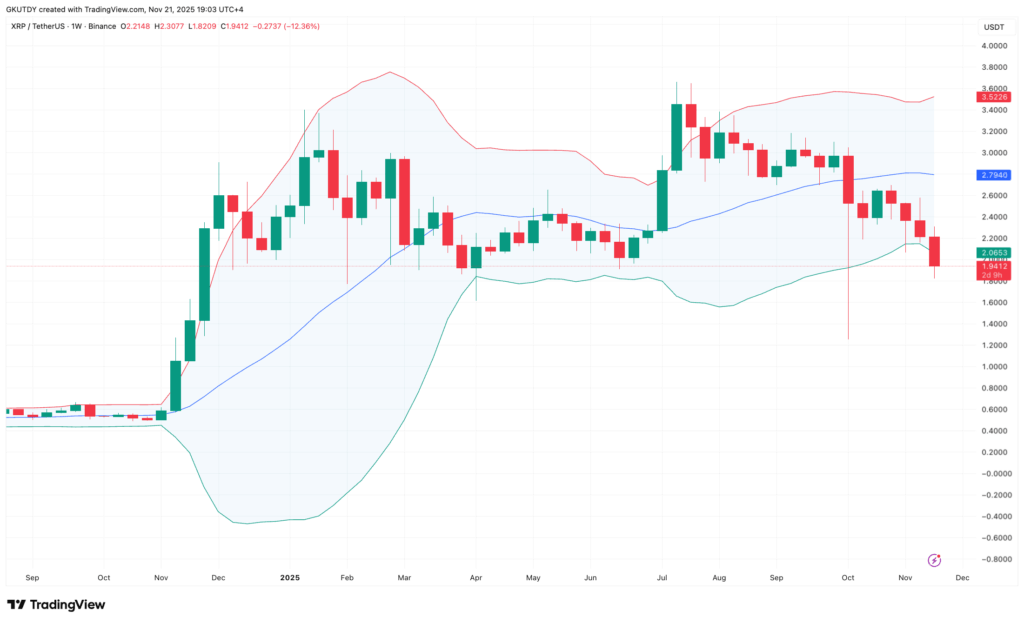
Last week, XRP appeared to plunge in what many traders perceived as a one-way liquidation. However, the weekend charts paint a different picture. While much of the market reacted to XRP losing the $2 mark as a catastrophic signal, the Bollinger Bands across higher timeframes suggest otherwise.
According to TradingView data, the price did not collapse into a void but instead touched the lower band on the weekly chart while remaining above the midband on the monthly frame. This pattern often emerges when panicked holders have already sold, and the asset enters a zone historically associated with exhaustion and potential reversal.
Weekly Chart Highlights Key Support
On the weekly chart, the lower Bollinger Band aligns closely with the candle, leaving virtually no gap beneath. This scenario has been observed in previous cycles, where traders prematurely declared the altcoin dead just before a significant recovery. The alignment suggests that despite the short-term sell-off, XRP is holding structural support at the broader timeframe.
Monthly Chart Reinforces Long-Term Trend
The monthly setup strengthens the outlook. The midband sits around $1.73, and XRP has respected this level even through four consecutive weeks of heavy declines. This indicates that while market sentiment has shifted dramatically, the deep-frame trend remains intact. Traders often get distracted by daily and intraday fluctuations, but those shorter timeframes do not dictate the structural path of the asset.


Daily and Intraday Volatility Can Mislead
At the daily and intraday levels, XRP shows messy wicks and failed midband retests, which can exaggerate perceived weakness. However, these distortions do not reflect the broader trend. Markets often lure participants into overreacting to short-term signals, while the real momentum plays out in higher timeframes.
Potential Reversal Zone
Currently, XRP is touching the lower volatility threshold after a multi-month decline, a zone where reversals have historically started. The convergence of weekly and monthly indicators suggests that the asset has absorbed much of the selling pressure, and structural support is holding despite heightened negative sentiment.
In summary, while traders may focus on short-term turbulence and price dips below psychological levels, XRP’s higher-timeframe charts indicate stability. The asset’s behavior on weekly and monthly Bollinger Bands reflects a market that has likely squeezed out panic selling, positioning it at historically significant zones where reversals typically begin.


Comments are closed.