

In the dynamic and rapidly evolving world of cryptocurrency markets, technical analysis tools serve as a crucial compass for investors. Among the myriad of chart formations, the Flag and Pennant Patterns stand out as critical structures that provide strong signals for trend continuation. They are indispensable for both seasoned veterans and new entrants. In this comprehensive guide, we will delve into the essence of these two popular formations, exploring their structure, the differences between them, how to interpret them in crypto markets, and how to effectively integrate them into trading strategies.
Featured News Headlines
The Fundamentals of Flag and Pennant Patterns
Flag and Pennant formations are classified as trend continuation patterns in technical analysis. This means that after an aggressive price movement (either an uptrend or a downtrend), the market undergoes a brief pause and consolidation. Crucially, this pause signals a high probability that the price will soon resume its movement in the direction of the initial trend.
Both patterns consist of two main components:
- The Pole: This is the initial, sharp price movement that precedes the formation, often accompanied by high volume. This movement is essential for establishing the strength of the existing trend and determining the potential price target.
- The Consolidation Area (The Flag/Pennant): This is the area where the price takes a breather following the pole, manifesting as a horizontal or slightly sloped corrective/tightening region. During this phase, a noticeable decrease in trading volume is typically observed.
These formations are short-term in nature and indicate that the current trend is merely taking a temporary break.


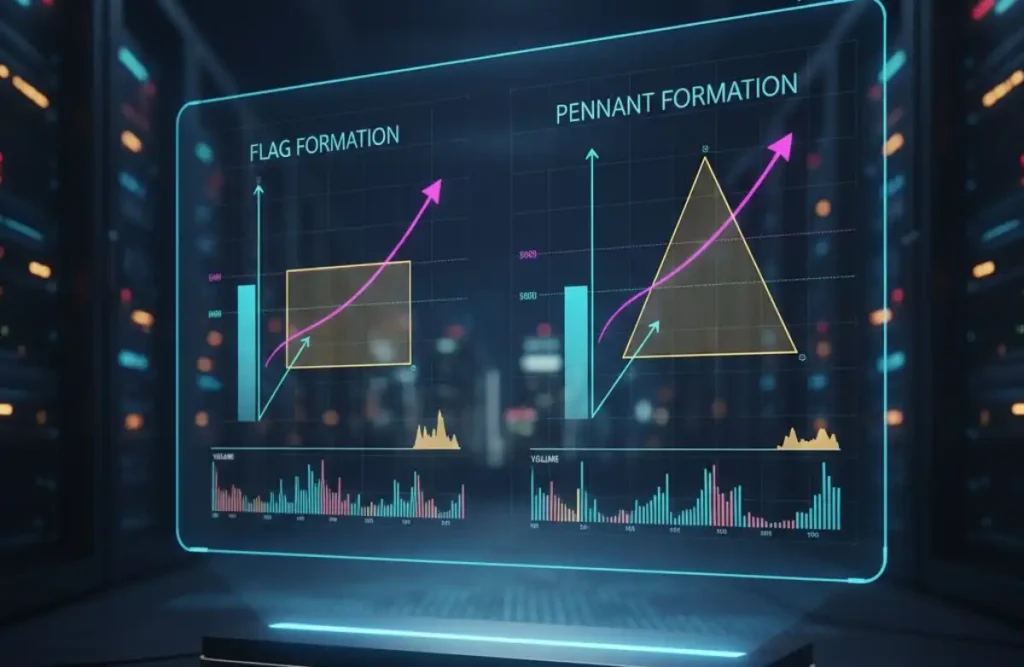
The Flag Pattern: A Rest in a Parallel Channel
The Flag pattern is characterized by a consolidation region that takes the shape of a rectangle, with the price moving between two parallel trend lines following the pole. This channel often slopes gently against the direction of the main trend.
- Bull Flag (Uptrend Flag): Formed after a strong upward surge (the pole), where the price consolidates within a parallel channel that typically slopes slightly downward. This is a strong indication that the rally is set to continue.
- Bear Flag (Downtrend Flag): Occurs after a sharp downward drop (the pole), with the price consolidating within a parallel channel that usually slopes slightly upward. This signals that the decline is likely to persist.
The Flag pattern is confirmed when the price breaks out of the flag region in the direction of the original trend, ideally with a surge in volume.
The Pennant Pattern: Tightening in a Triangle
The Pennant pattern operates on a similar principle to the Flag pattern, but its consolidation area is defined by two converging trend lines, resulting in a shape resembling a small, symmetrical triangle. The appearance suggests a tighter and faster squeeze compared to the Flag.
Pennant formations also come in two variations:
- Bull Pennant (Uptrend Pennant): Formed after an upward pole, where the price tightens within a small, converging triangle. The expected breakout is upward.
- Bear Pennant (Downtrend Pennant): Formed after a downward pole, where the price tightens within a small, converging triangle. The expected breakout is downward.
Due to its tighter structure, the Pennant may indicate a faster decision-making process by the market, potentially leading to a more aggressive move after the breakout compared to the Flag.
The Key Distinction Between Flag and Pennant
While both are trend continuation patterns, they are visually and structurally distinct:
| Feature | Flag Pattern | Pennant Pattern |
| Consolidation Shape | Confined by parallel (rectangular) lines, forming a channel. | Confined by converging (tightening) lines, forming a triangle. |
| Appearance | A slightly sloped rectangle. | A small, symmetrical triangle. |
| Duration | Can last slightly longer than a Pennant. | Usually a shorter and quicker formation than a Flag. |
Trading Strategies: Utilizing Flags and Pennants in Crypto
To effectively use these formations in your cryptocurrency trading, you must follow these essential steps and pay attention to critical nuances:
1. Accurate Identification: The Pole and Consolidation
Begin by identifying the strong, high-volume price movement—the “Pole”—on the chart. Immediately following this, draw the trend lines defining the “Flag” or “Pennant” consolidation area. Parallel lines indicate a Flag, while converging lines signal a Pennant.
2. Volume Analysis: Validating the Formation
Volume plays a vital role in validating the reliability of these patterns:
- Pole Formation: Must be supported by high and increasing trading volume, confirming the strength of the initial move.
- Consolidation Period (Flag/Pennant): Trading volume must decrease while the price is resting. This suggests that traders are in a period of indecision, and major accumulation/distribution has not yet occurred.
- Breakout Moment: When the price breaches the consolidation area (the breakout), there must be a significant increase in trading volume. Breakouts without high volume (false breakouts) are generally unreliable.
3. Setting Targets: The Pole Length Rule
The price target for both Flag and Pennant formations is typically projected using the length of the Flag/Pennant Pole.
- Measurement: Measure the vertical distance from the beginning of the Pole to the start of the Flag/Pennant consolidation.
- Target: Project this measured distance from the point of the breakout. This provides a minimum expected price level for the trend continuation.
Example: Bitcoin (BTC) surged sharply from $40,000 to $45,000 (a $5,000 pole length) and then formed a bull flag. The price subsequently broke out above the flag at $44,000. The expected minimum target price is: $44,000 (Breakout Point) + $5,000 (Pole Length) = $49,000.
4. Risk Management and Stop-Loss
Regardless of the formation’s reliability, market uncertainty is ever-present, making robust risk management mandatory:
- Entry: Enter the position only after the breakout has been confirmed with high volume.
- Stop-Loss: Set the stop-loss order slightly beyond the extreme edge of the consolidation area, opposite the breakout direction. For a bullish pattern, the stop-loss should be placed just below the lowest support line of the Flag/Pennant; for a bearish pattern, just above the highest resistance line. This mitigates significant losses should the formation fail.
Important Caveats and Limitations
While Flag and Pennant formations provide strong signals, they are not infallible:
- False Breakouts (Fakeouts): Sometimes the price appears to break out but quickly reverses back into the formation. It is crucial to wait for confirmation, ideally with strong volume and a candle close outside the pattern.
- Market Conditions: The volatile and speculative nature of the crypto market means formations may not play out as expected. Macroeconomic events and regulatory news can instantly invalidate the pattern.
- Confirmation with Other Indicators: Always enhance the reliability of the signal by combining the formation with other technical indicators like RSI, MACD, and Moving Averages. For instance, an RSI moving above 50 during a bullish breakout provides an extra layer of confirmation.
Experience and Vigilance Are Key
The Flag and Pennant patterns are two of the most popular and reliable continuation patterns in crypto technical analysis, representing a brief “rest” after a forceful “pole” move. Correctly identifying these structures, confirming them with volume, and meticulously applying risk management will empower traders to capitalize on market trends. Remember, success in technical analysis stems not only from knowing the formations but also from disciplined execution of your strategy.


Comments are closed.