


XRP’s Volatile Battle for Recovery: Can It Hold Against Growing Bearish Pressure?
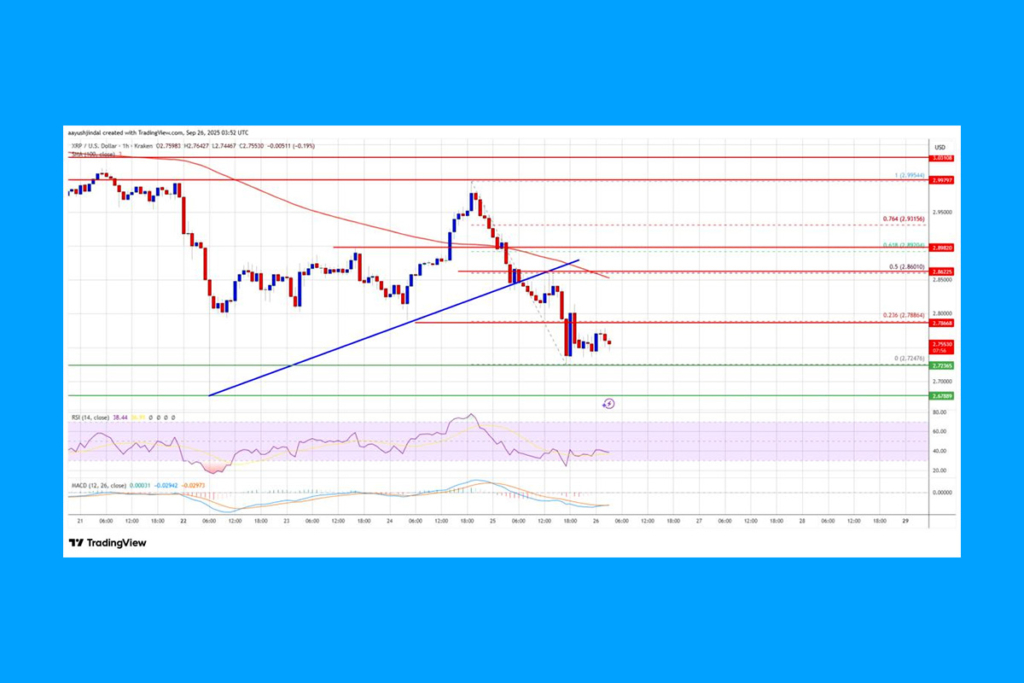
The price of XRP outperformed Bitcoin and Ethereum in its bid to recover over the $2.90 mark. Before the bears showed up, the price managed to break over the resistance levels of $2.90 and $2.92. The price began a new drop after reaching a high of $2.99. Below the $2.90 support, there was a decline. In addition, the hourly chart of the XRP/USD pair showed a break below a connecting positive trend line with support at $2.85.
XRP Technical Chart Signals Potential Surge Toward $3.00
The 100-hourly Simple Moving Average and $2.70 are currently below the price. If the price is rising, it may encounter resistance close to the $2.78 mark. The first significant resistance is located close to the 50% Fib retracement level and the $2.85 level, which represents the recent slide from the $2.99 swing high to the $2.724 low. Price movement toward the $2.92 resistance could occur if there is a clear rise above the $2.85 resistance. If the price continues to rise, it may move toward the resistance level of $2.95. Near $3.00 could be the bulls‘ next significant obstacle.
XRP Faces Bearish Pressure: $2.85 Resistance Could Trigger Decline to $2.60
XRP may continue to decline if it is unable to overcome the $2.85 barrier level. The $2.72 level is the first downward support. The $2.68 level is close to the next significant support. The price may continue to drop toward $2.61 if there is a negative break and a closure below the $2.68 mark. The price may turn bearish below the $2.60 zone, which is the next significant support.
For more up-to-date crypto news, you can follow Crypto Data Space.


Comments are closed.