

SEI Price Action: Next Major Move Amid Sharp Reversal
Following a severe rejection of its weekly high, the SEI has entered a new phase of volatility. Traders are analyzing this reaction to determine whether it is a setup for another breakout attempt or the beginning of a deeper decline. The move is indicative of traditional liquidity behavior, in which the price sweeps a significant level before sharply reversing. Additionally, this suggests that astute investors may be preparing for the next significant change.
SEI Price Maintains Tight Volatility Structure After Pullback
According to a chart released by market analysts, SEI conducted a clean liquidity sweep at the weekly high before abruptly reversing. This is a typical occurrence for assets with significant volatility. Technical commentary states that the price quickly rotated back toward the mid-range after initially expanding upward and tapping liquidity above the range. Rather than confirming a continued rally, this response reflects a distribution-style pattern.
According to recent data, SEI is trading at about $0.16, down a little from the previous day. However, it still has a market capitalization of more than $1 billion. The coin maintains its position in the $0.16–$0.18 range despite the decline, supporting a tight volatility structure. The most crucial consolidation zone, according to analysts, is the $0.152–$0.210 range; reclaiming its upper half might revitalize the bullish continuing story.
Bollinger Bands Suggest Momentum Building in SEI
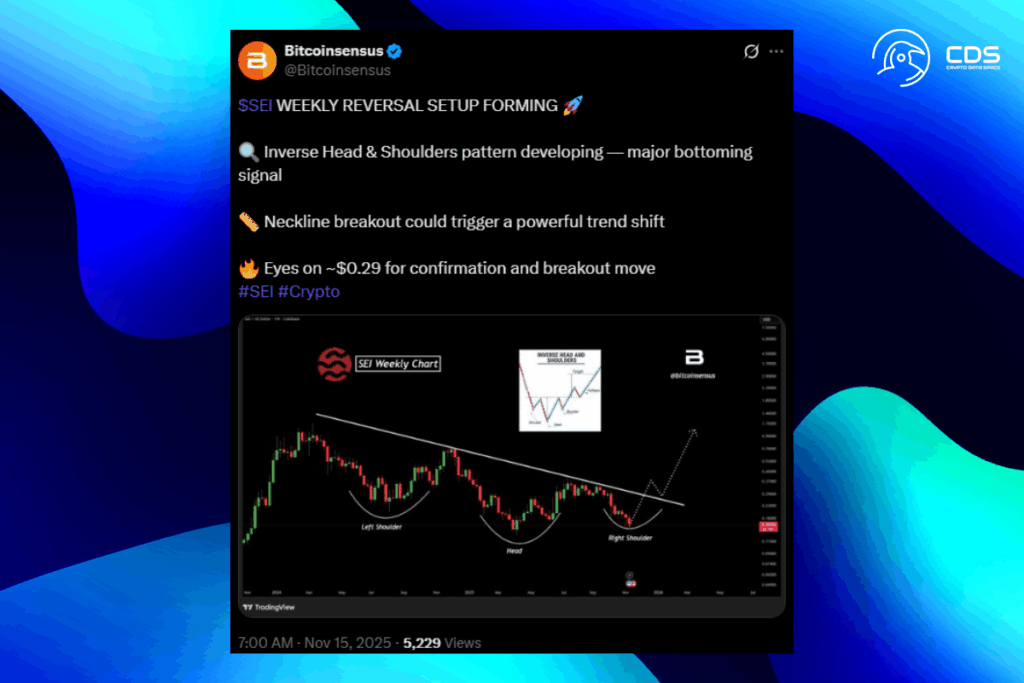
SEI is trading below a long, dropping trendline on another 1-hour timeframe chart. Lower highs and lows are consistently emerging as a result. Recent candles indicate that buyers are attempting to recover momentum following a corrective dip by probing the trendline resistance. Larger players are still active if there are liquidity inflows prior to the retracement. However, a clear breach of the declining resistance is necessary for confirmation.


The Bollinger Bands show increasing volatility with price hovering above the basis line, and the MACD is in a bullish alignment, both of which are indicators of increasing momentum. However, previous touches in the vicinity of the top band have led to fatigue rather than persistence. This implies that a big structural shift and high volume are necessary for any effort at breakout.
For more up-to-date crypto news, you can follow Crypto Data Space.


Comments are closed.