


EMA Crossovers Signal Potential Breakdown
On the 12-hour chart, Hedera Hashgraph (HBAR) is showing increasing signs of weakness. Two crucial bearish EMA crossovers appear imminent. The 20-EMA (orange) is nearing the 100-EMA (sky blue), while the 50-EMA (red) is closing in on the 200-EMA (deep blue). If both crossovers complete, they may confirm growing downside momentum.
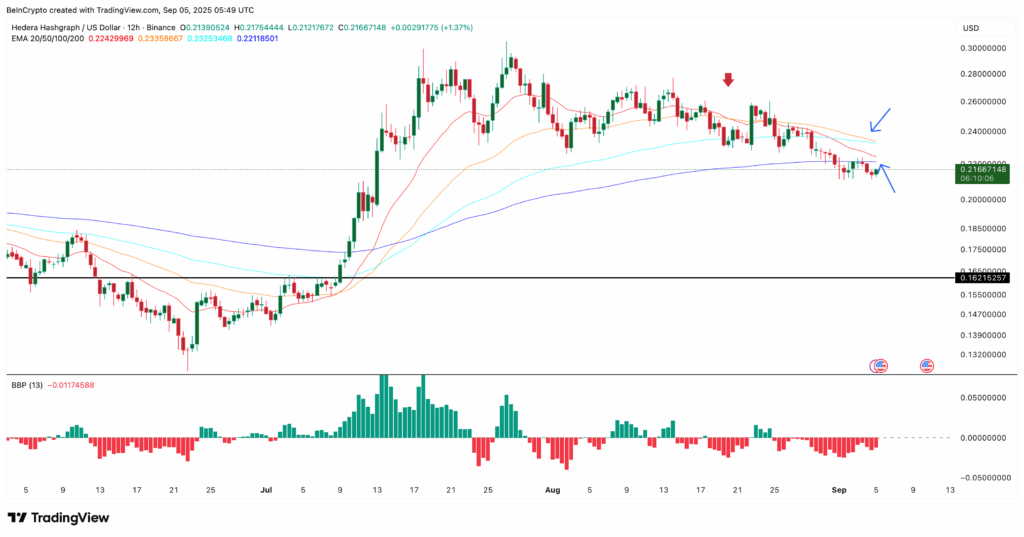
Historically, similar patterns have triggered declines. On August 20, for instance, the 20-EMA crossed below the 50-EMA, leading to a drop in HBAR price from $0.24 to $0.22 within a few sessions.
EMAs—Exponential Moving Averages—help smooth price action and identify trend direction. A crossover where shorter EMAs fall below longer ones typically signals a shift in momentum toward sellers.
Weak Buyer Interest and Strengthening Bear Control
Currently, HBAR is trading below all major EMAs, a sign that bears are firmly in control. The bull-bear power indicator confirms this, with growing red bars indicating expanding bearish strength.


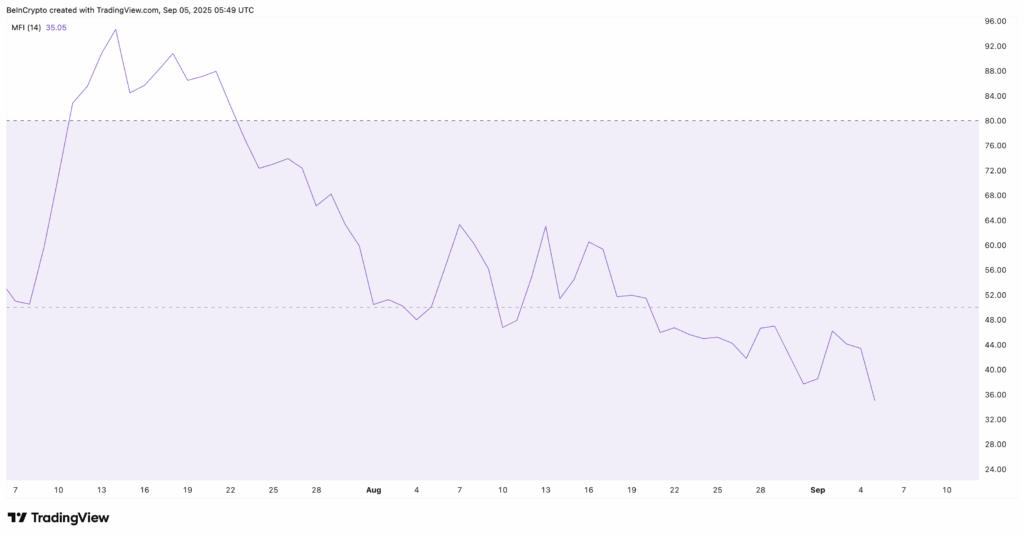
Additionally, the Money Flow Index (MFI) has dropped to 35, suggesting reduced buying volume and increased selling pressure. This combination of technical signals supports the case for a deeper correction.
If support at $0.210 fails, analysts are watching $0.162 as the next key level, a strong support area seen on both 12-hour and daily charts.
Wedge Pattern Offers Limited Bullish Hope
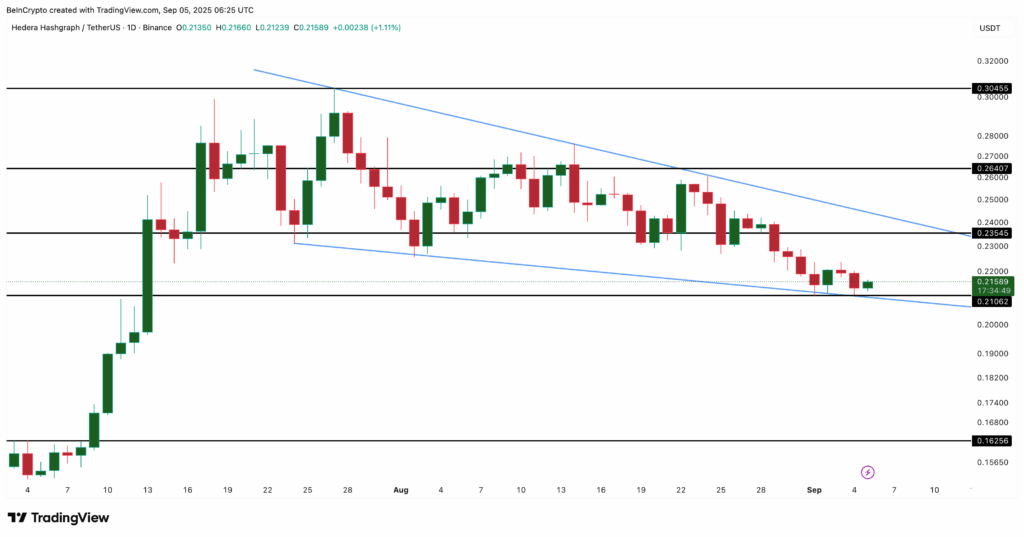
On the daily chart, HBAR is trading within a falling wedge, a structure that can suggest a bullish reversal. However, a valid breakout requires a move above $0.235. If bulls succeed, HBAR may retest $0.264 or even $0.304.
Until that breakout happens, bearish momentum remains dominant, and risks of further downside persist.


Comments are closed.