


Featured News Headlines
- 1 FLOKI Price Eyes Rebound from Key Fibonacci Support
- 2 Chart Setup Shows Strength at 0.618 Fibonacci Level
- 3 Market Activity Reflects Investor Engagement Amid Pullback
- 4 Bollinger Bands and Momentum Indicators Suggest Short-Term Volatility
- 5 Price Outlook: Holding Support Is Crucial for Bullish Continuation
FLOKI Price Eyes Rebound from Key Fibonacci Support
Floki Inu (FLOKI) is approaching a pivotal price zone, with technical indicators suggesting the potential for a near-term rebound—if critical support levels hold. Analysts point to a confluence of bullish signals, including Fibonacci retracement zones, volume dynamics, and momentum indicators, that could shape FLOKI’s next major move.
Chart Setup Shows Strength at 0.618 Fibonacci Level
According to recent analysis by Pelin Ay (@PelinayPA), FLOKI is trading within a well-defined upward price channel, with particular attention on the 0.618 Fibonacci retracement level, a historically reliable support zone in trending markets.
This retracement level, which currently coincides with price activity near $0.00009480, is viewed as a key inflection point. A successful hold could pave the way for a bounce toward the 0.786 Fibonacci extension, which would indicate renewed bullish strength and higher resistance testing in the near term.
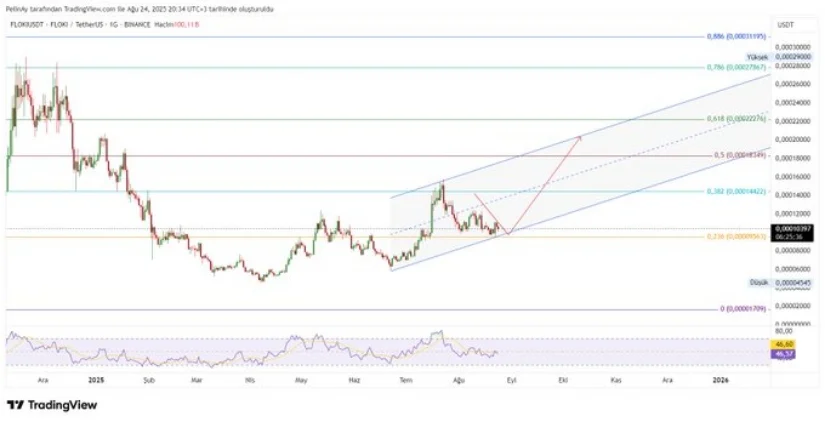
“The current setup shows price structure respecting the mid-channel,” Ay noted, “with RSI remaining balanced and offering room for upward movement.”


Indeed, the Relative Strength Index (RSI) currently sits in neutral territory, suggesting that FLOKI is neither overbought nor oversold. This condition typically leaves room for price continuation, especially within a broader ascending pattern.
Market Activity Reflects Investor Engagement Amid Pullback
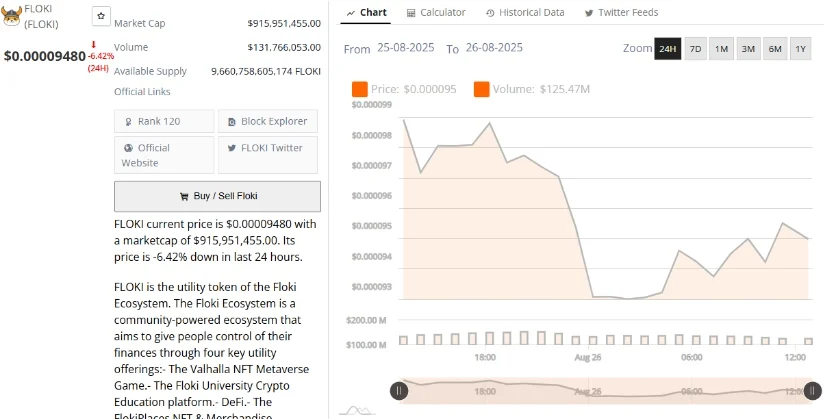
While FLOKI recently experienced a 6.42% price decline over the last 24 hours—likely linked to broader crypto market weakness or turbulence in the memecoin space—the $125 million in daily trading volume reflects active investor participation.
At the time of writing, FLOKI holds a market cap of approximately $916 million, making it one of the more prominent memecoins by valuation. This level of liquidity, combined with trading interest, supports the case for continued price action in the near term, assuming broader market sentiment remains risk-on.
The token’s underlying ecosystem—including its Valhalla Metaverse, DeFi tools, and educational platforms—has also added to its long-term narrative, providing utility beyond speculation. However, the immediate technical structureshows price consolidating near support, awaiting a breakout or breakdown trigger.
Bollinger Bands and Momentum Indicators Suggest Short-Term Volatility
FLOKI’s recent price activity has coincided with expanding Bollinger Bands, a technical signal often associated with heightened volatility. This pattern reflects recent surges in price and buy volume, but also flags caution as the asset approaches the upper Bollinger Band—a level historically associated with pullbacks or sideways movement.
If resistance near the upper band holds, short-term consolidation or retracement may follow. On the flip side, a strong breakout above this threshold—combined with increasing volume—could validate bullish continuation and open the path toward targets around $0.00018.

Market watchers are keeping a close eye on RSI and volume trends to determine whether current momentum can be sustained. With RSI still below the overbought zone and volume showing strength, the technical outlook remains cautiously optimistic—but not without risk.
Price Outlook: Holding Support Is Crucial for Bullish Continuation
With FLOKI currently trading above a critical Fibonacci support zone, the next few trading sessions will be key in defining its short-term trajectory. A solid hold at the 0.618 level—supported by volume confirmation—could trigger a bullish leg upward, especially if broader market sentiment aligns.
Should price fail to hold that threshold, however, FLOKI risks entering a less favorable zone, where overhead resistance may stall upward moves and invite bearish pressure.
Technical indicators like the Squeeze Momentum Indicator show potential for a shift from consolidation to trending, supporting the idea of an imminent move. Whether that move continues higher or dips back into lower support will likely depend on how traders respond to current levels and macro market signals.


Comments are closed.