


Featured News Headlines
Ethereum Rebounds From Recent Lows
Ethereum (ETH) has rebounded nearly 10% from this week’s low of $2,600, and as of today, it shows a modest 1% gain. While this recovery may appear positive at first glance, market signals suggest that the rally might not sustain.
Two significant bearish signals have emerged simultaneously, presenting a potential threat to the early stages of the recovery. These combined indicators point to deeper structural weakness in the market.
Sharp Increase in Hodler Sales
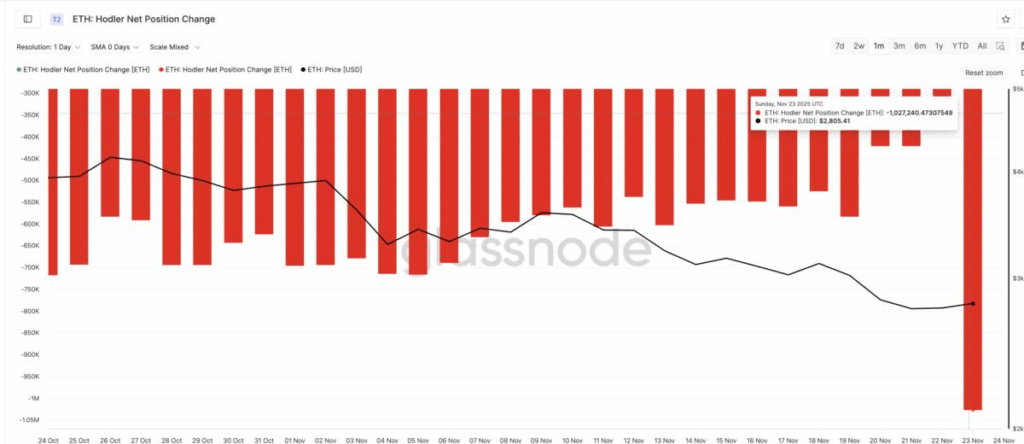
The first warning comes from long-term investors, often referred to as hodlers. These are wallets that typically hold ETH for more than 155 days. When hodlers increase their selling activity, it often signals either fear or a shift in long-term market confidence.
On November 22, net sales from these wallets were approximately 334,600 ETH. Just a day later, on November 23, this figure surged to 1,027,240 ETH, marking a 300% increase in a single day. Such a large outflow from long-term holders adds substantial supply pressure, particularly when ETH is already trading within a broader downward trend.


As noted by cryptocurrency analyst Harsh Notariya, “A sudden increase in hodler sales amplifies short-term selling pressure and signals that market participants are reassessing their long-term confidence in Ethereum.”
The Impending Death Cross
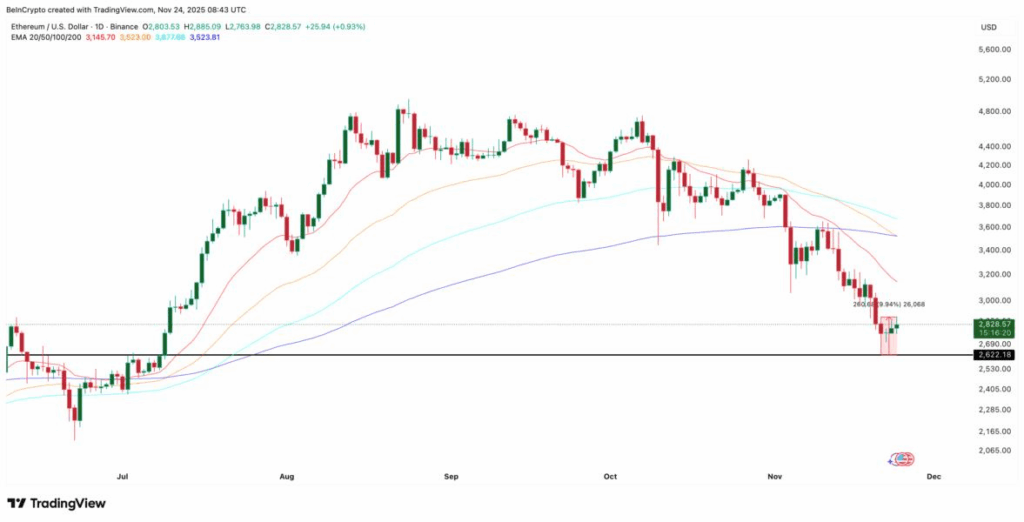
The second signal is a nearly completed death cross, a key technical indicator. A death cross occurs when the 50-day exponential moving average (EMA) falls below the 200-day EMA. Unlike simple moving averages, EMAs give more weight to recent price activity, allowing faster reactions to market changes.
When the 50-day EMA crosses below the 200-day EMA, it typically indicates strong downward momentum. If selling pressure persists, this could have a significant impact on Ethereum prices.
Interaction Between Hodler Sales and Death Cross
Critically, hodler sales are accelerating precisely as the EMA structure shifts downward. This simultaneous appearance of both signals suggests that selling pressure could reinforce, rather than slow down, the effects of the death cross. Historically, when such conditions coincide, short-term recoveries often fail, and prices tend to retest lower support levels.
Ethereum’s Key Support Levels
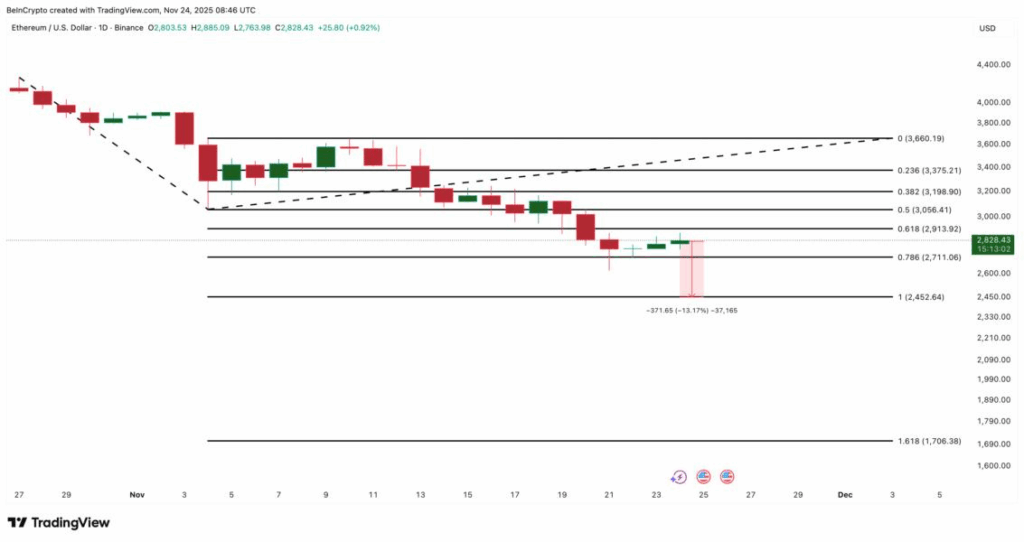
Currently, Ethereum trades around $2,820, but technical charts show higher pressure above and less support below.
The first major support level ETH needs to hold is $2,710, corresponding to the 0.786 Fibonacci retracement level. Breaching this level could pave the way for a decline of roughly 13% to $2,450.
If the death cross completes and hodler selling continues, ETH could test this level directly and potentially move even lower. Below $2,452, the next significant support is around $1,700, representing the extended range of the downtrend. This level becomes relevant if downward momentum accelerates and sellers dominate the market.
Resistance Levels and Limited Upside
On the upside, recovery faces substantial obstacles. ETH must first overcome $3,190, a key resistance level, followed by $3,660, which would indicate an early trend reversal. Given current conditions, reaching these levels appears challenging, as both bearish signals—the rise in hodler sales and the developing death cross—remain active.
Technical and Market Implications
While short-term price action shows signs of recovery, the combination of hodler selling and the death cross points to ongoing market vulnerability. The interplay of these two indicators suggests that downside risks currently outweigh upward momentum.
Analysts highlight that “Ethereum recoveries tend to be short-lived when both hodler selling increases and technical bearish signals coincide, underscoring persistent market pressure.”
In conclusion, although Ethereum has recovered from recent lows, two critical indicators—a sharp increase in hodler sales and the formation of a death cross—signal that market conditions remain fragile.
Technically, ETH could retest $2,710–$2,450 support levels if the current bearish trends continue. Meanwhile, upside potential remains limited, and breaching significant resistance levels such as $3,190 and $3,660 appears unlikely under present market dynamics.
The combination of hodler behavior and moving average structures provides a detailed view of Ethereum’s current vulnerability, highlighting the importance of monitoring both technical and on-chain indicators to understand short-term market sentiment.


Comments are closed.