


Featured News Headlines
Ethereum Analysis: $3,000 Retest or $4,000 Rebound Ahead?
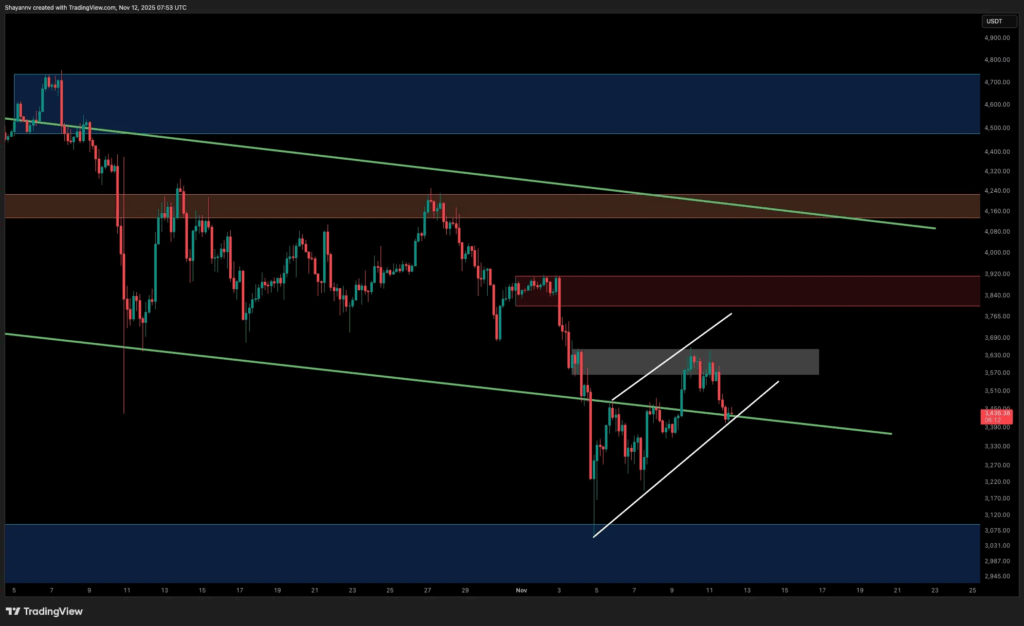
Ethereum remains trapped in a downtrend, and the technical structure continues to weaken. The price is moving within a descending parallel channel on the daily chart, with repeated rejections from upper and middle boundaries showing sellers maintain control. Unable to hold above the $3,600-$3,700 resistance zone, ETH is now testing the channel’s lower boundary and the 200-day moving average (around $3,300).
This zone has become a critical battleground between bulls and bears. A clean close below the 200-day MA could push ETH into a deeper correction, potentially targeting the $3,000-$3,100 demand zone where significant liquidity awaits. Conversely, reclaiming $3,600 could revalidate the bullish recovery structure.
Daily Chart: 200-Day MA Under Examination
Ethereum’s confinement within the descending parallel channel on the daily timeframe confirms the trend structure remains downward. The price recently tested the $3,600-$3,700 range but failed to establish a sustainable foothold above this zone. Selling pressure has intensified again, and ETH is now conducting a critical test between the channel’s lower boundary and the 200-day moving average.
The support zone around $3,300 emerges as the key level that will determine short-term direction. If a clean close occurs below the 200-day MA, the likelihood of ETH conducting a deeper test toward the $3,000-$3,100 region strengthens. This level is historically recognized as a significant accumulation area, and a strong liquidity pocket is expected to reside there.


Conversely, if the price reclaims the $3,600 level, the bullish recovery scenario could reactivate. In this case, the next target would be the $3,900-$4,000 range, where major unmitigated supply exists. However, the RSI momentum indicator dropping below the 50 midline signals deteriorating short-term strength and suggests caution until the structure stabilizes.
4-Hour Chart: Short-Term Weakness Becomes Evident
On the lower timeframe, Ethereum broke below a local ascending channel, and this technical breakdown confirmed short-term weakness. The $3,450-$3,500 range, which previously functioned as support, now operates as intraday resistance. This zone, overlapping with the failed channel’s lower boundary, indicates downside pressure will continue as long as the price remains below this level.
The next significant liquidity area sits around $3,200-$3,300, and this zone overlaps with the midline of the daily descending channel. If selling pressure intensifies, this region could serve as a potential reaction base for short-term buyers. However, a clean break beneath this support would shift focus to the $3,000-$3,100 macro demand zone.
This level represents the same region visible in the daily structure and historically known as a significant accumulation area. The short-term chart shows the price moving toward these critical supports, and the next major move will likely take shape once one of these zones is reached.
Liquidity Map: Two-Way Risk Zones
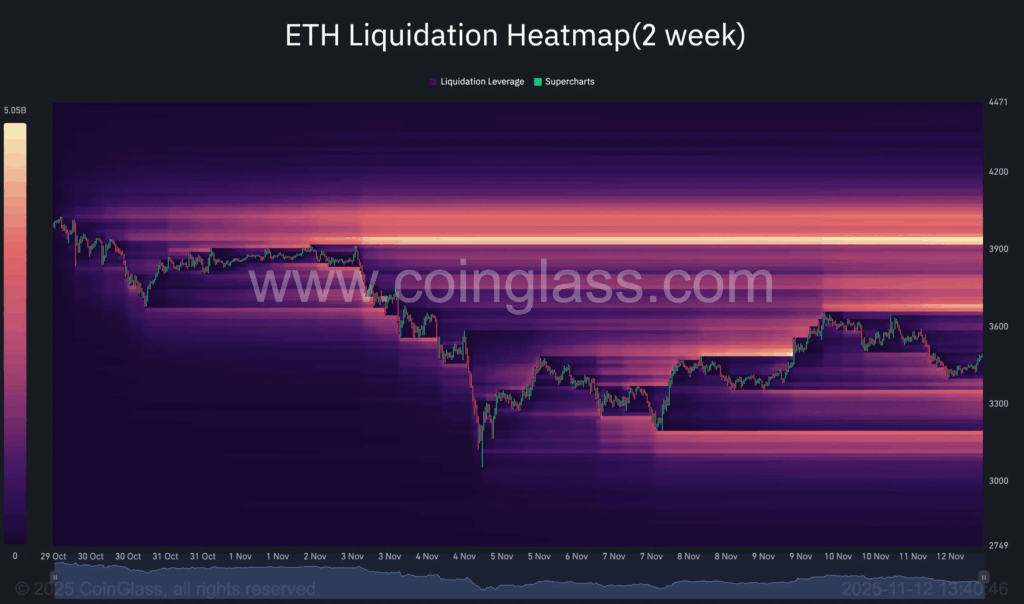
The ETH 2-week liquidation heatmap reveals leveraged positions concentrated in two major zones. This data suggests the next directional move will likely be liquidity-driven.
Above $3,800-$3,900: Dense short liquidation clusters exist in this region. If any breakout rally reaches this area, rapid upward movement could be triggered as shorts are forced to close. This scenario carries potential for a late-stage short squeeze.
Below $3,200-$3,000: A wide long liquidation zone awaits at this level. If aggressive downside wicks extend into this region, they could function as a liquidity grab, followed by a potential rebound.
Currently, Ethereum is positioned between both extremes, trading in a compressed equilibrium. This situation reinforces the idea that the next directional move will likely be shaped by a liquidity sweep.
Conclusion: Ethereum at a Critical Crossroads
Ethereum stands at a technically sensitive point, and price action in the coming days will determine the medium-term trend direction. Maintaining the 200-day moving average carries critical importance for bulls, while losing this support could trigger a deeper correction.
The liquidity map indicates strong movement potential in both directions. Investors should closely monitor the $3,000-$3,100 and $3,800-$3,900 zones, as these levels could serve as starting points for the next major move.


Comments are closed.