


Featured News Headlines
ETH Shows Bullish Signals as Whales Accumulate
As new on-chain patterns emerge, analysts are closely watching whether Ethereum (ETH) can replicate its historically strong November performance.
Historical November Trends Favor Ethereum
Ethereum has shown bullish tendencies in November, with average gains above 6.9% over the past eight years. Notably, in 2024, ETH posted a 47.4% rally, marking one of its strongest monthly performances on record.
“Despite October’s weakness, the market structure suggests a potential setup for a similar rebound, as one of the selling incentives keeps declining,” according to market observations.
The Net Unrealized Profit/Loss (NUPL) — which tracks whether investors hold profits or losses — has fallen from 0.43 to 0.39 since October 26, a 9.3% decline. This is near the monthly low of 0.38, which previously coincided with a 13% ETH price jump from $3,750 to $4,240. This drop indicates that selling pressure may be fading, a common precursor to price stabilization.


Whales and Holders Could Shape November
Ethereum’s on-chain data shows a divergence between whales and long-term holders. While long-term holders have slowed accumulation, whales are quietly building positions.
The Holder Accumulation Ratio (HAR) from Glassnode, which measures the balance between addresses increasing versus reducing holdings, dropped from 31.27% to 30.45% since late October. This suggests that while long-term holders are trimming exposure, whales are accumulating, likely driven by confidence in Ethereum’s staking yields and growing tokenized infrastructure.
If HAR stabilizes in November, it could signal retail conviction aligning with whale confidence, amplifying potential market recalibration.
Technical Setup Supports Potential Upside
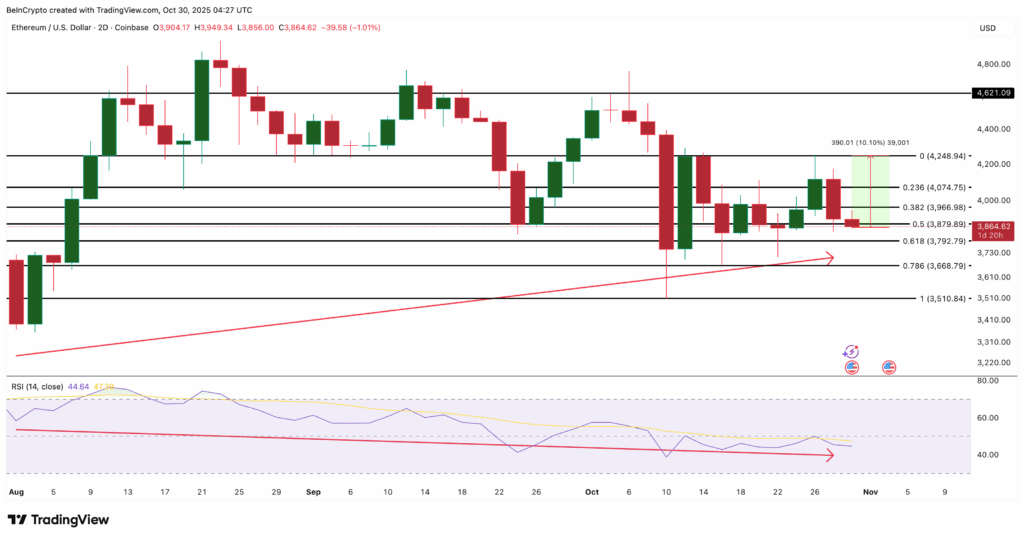
On the 2-day chart, Ethereum displays a hidden bullish divergence, where price forms higher lows while RSI forms lower lows. Between August 21 and October 28, this pattern suggested weakening selling pressure and potential upside for ETH.
Currently, Ethereum trades near $3,860, facing resistance around $4,070 and $4,240. Over the past three months, ETH has gained over 5%, supporting the notion of a broader uptrend.


Comments are closed.