


Featured News Headlines
BTC Weekly Pullback – Bitcoin Correction Signals Possible New Base Below $120K
BTC Weekly Pullback – Bitcoin [BTC] closed July with a 4.26% red weekly candle, marking its first significant correction in weeks. Historically, such pullbacks have often signaled a re-accumulation phase, hinting that the market might be preparing for the next move upward rather than a prolonged downturn.
Historical Patterns Suggest a Third Base Building
Since Q2, Bitcoin has maintained a pattern of higher lows, showing resilience amid corrections. Previously, after a 5% weekly dip, BTC found strong support around $77K, which sparked a rally to $109K. Later, a consolidation zone between $105K and $109K fueled the breakout to its all-time high near $123K.
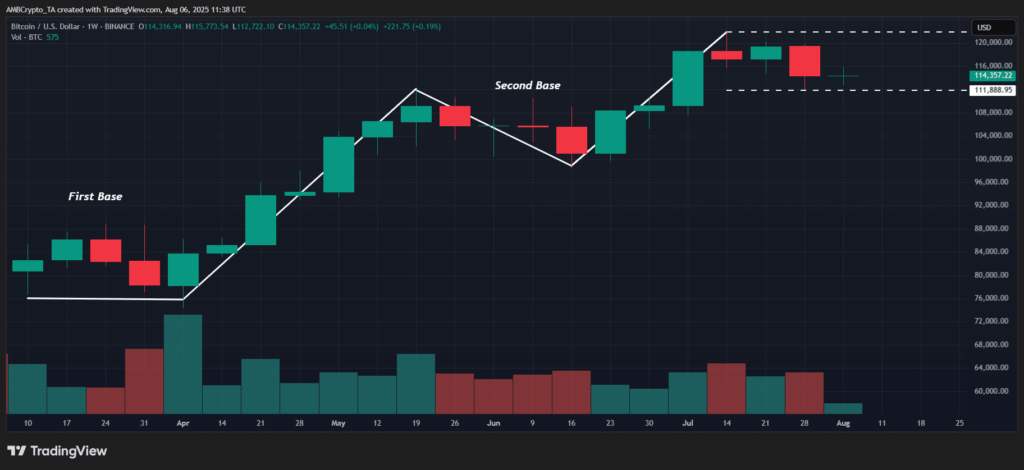
Now, with the latest weekly dip and BTC printing its fourth weekly candle post-ATH, analysts suggest that a third base could be forming between $110K and $119K. This fits the historical pattern where consolidation lasted roughly four weeks before a price surge.
Liquidity Cluster and Orderbook Signal Mixed Sentiment
Around $114.5K, a notable yellow liquidity cluster has formed, accumulating nearly $24 million in short-side liquidity. A sweep of this level could reinforce BTC’s structural support. However, for this to translate into a sustainable rally, a clear shift towards bid-side dominance is necessary.


Currently, Bitcoin’s 10% Bid-Ask Ratio on Binance Spot favors the ask side, indicating sellers hold the upper hand. Both bid-ask histograms show weak buyer interest, with values below their 24-hour averages. The volume on the weekly chart also supports this view, as red volume bars stack up while green bars remain subdued compared to previous base-building phases.
What’s Next for Bitcoin?
Bitcoin appears to be probing for a base, but the lack of strong buy-side commitment and muted volume suggests that bulls have yet to fully engage. Without increased on-chain accumulation beneath these key levels, any upward push risks losing momentum.
For now, the market remains cautious as BTC balances between structural support and seller pressure, waiting to see if the historical pattern of re-accumulation repeats once again.


Comments are closed.