


Featured News Headlines
Death Cross Looms as Analysts Monitor Bitcoin’s November Support
As Bitcoin hovers near crucial technical levels, analysts are divided on what comes next. Some rely on traditional indicators like the upcoming Death Cross, while others turn to more unconventional signals — including lunar cycle timing — to forecast a possible bottom in November.
Death Cross Nears as Analysts Eye November Bottom
Bitcoin’s 50-day and 200-day simple moving averages (SMAs) are expected to intersect in mid-November near $100,000, forming what traders call a Death Cross.
Although the term often sounds bearish, history suggests otherwise. According to Binance Research, Bitcoin’s average performance one month after a Death Cross is -3.2%, indicating that the event usually marks local bottoms rather than long-term reversals.
Analyst Colin believes the “lowest reasonable level” for Bitcoin in this current bull cycle is around $98,000, an area aligning with several strong supports, including the 50-week SMA, which has held since early 2023.
“Bitcoin has not closed a weekly candle below the 50-week SMA since Q1 2023,”
noted analyst Ted Pillows in an October update.


That key average now sits near $102,800, a level many traders see as the critical line separating the ongoing bull run from a potential macro correction.
Rising Wedge Pattern Hints at 15–35% Correction
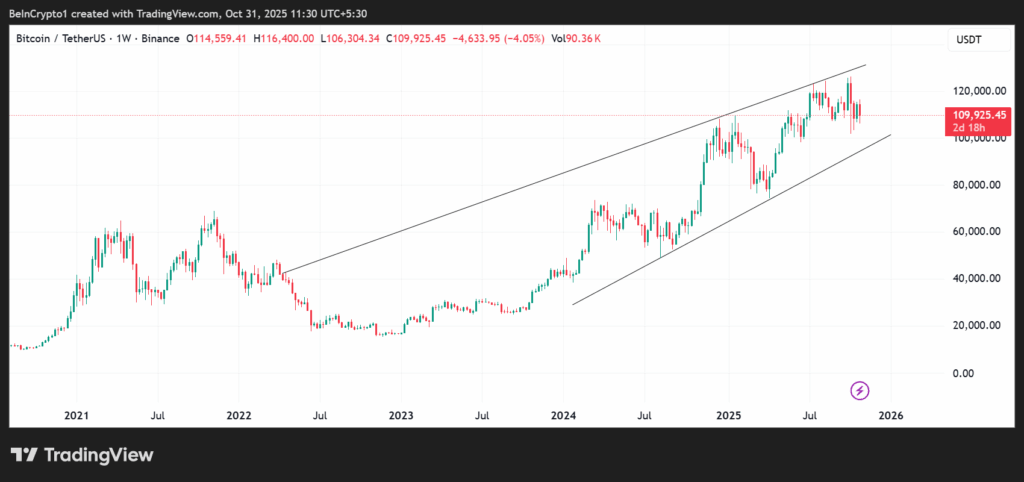
Despite solid long-term momentum, Bitcoin’s weekly chart currently forms a rising wedge — a bearish setup characterized by narrowing price action and declining buying strength.
Historically, this pattern led to 15–35% corrections in previous cycles, including 2018 and 2021.
Still, the broader trend remains intact. Bitcoin continues to chart higher highs and higher lows within its long-term ascending channel, in place since 2022.
Historically, rebounds from the lower boundary of this channel have yielded 60% to 170% gains, reinforcing the view that the structure remains bullish despite short-term risks.
Lunar Cycle Analysis Adds Unconventional Insight
Adding a unique twist, several analysts have begun overlaying lunar phases on Bitcoin’s price charts.
Analyst LP_NXT observed that First Quarter moons — such as the one on October 29, 2025 — often coincide with the start of bullish momentum that extends into the Full or Third Quarter moon phases.
“When mapped alongside moon cycles, Bitcoin’s 2025 price rhythm shows a clear pattern,” LP_NXT explained.
This correlation appears to align with technical forecasts that mid-November could represent a local bottom.
Supporters of lunar timing argue it reflects recurrent investor psychology, rather than superstition.
While not part of traditional charting methods, the recurrence of lunar-based analyses highlights the diversity of trader strategies within the crypto market.
The convergence of lunar timing, strong support levels, and moving average signals makes November 2025 a key period to watch.
Bullish Framework Holds Amid Consolidation
Bitcoin’s current sideways movement between $105,000 and $110,000 is being interpreted by analysts as a consolidation phase, not a breakdown.
Colin emphasizes patience, suggesting that this extended cycle is “testing investor conviction,” especially among altcoin traders waiting for a typical Q4 surge.
In past cycles, Bitcoin occasionally defied patterns — such as when its 2022 bear market low of $15,000 fell below the previous cycle’s $20,000 peak, a first in the asset’s history.
Colin advises focusing on the long-term structure rather than short-term volatility, noting that “Bitcoin’s real opportunity comes after a confirmed new all-time high.”
Meanwhile, Ledger’s market education reports echo that sentiment, noting that the Death Cross is less a predictor of future declines and more a lagging indicator of exhaustion — often preceding capitulation and reversal rather than deepening sell-offs.


Comments are closed.