

Bitcoin Whales Accumulate Amid Market Calm
Recent analysis suggests Bitcoin’s liquidity may be approaching a critical juncture. The Stablecoin Supply Ratio (SSR), a key metric tracking stablecoin liquidity relative to BTC, has returned to its “lower historical range.” CryptoQuant analyst MorenoDV noted:
“Each time, Bitcoin was trading quietly before staging a strong rebound.”
This low SSR indicates that stablecoin liquidity is quietly building, potentially setting the stage for a relief rally or the final bullish leg of the current cycle.
The Binance Bitcoin/Stablecoin Reserve Ratio (SRR) shows a similar trend. Stablecoin reserves on the exchange are rising while BTC reserves shrink. According to MorenoDV:


“We’re witnessing a liquidity configuration that has only appeared a handful of times since 2020, and each instance marked a pivotal moment for Bitcoin’s trajectory.”
This pattern often emerges during structural capitulation or seller exhaustion phases, when weak hands exit and strong hands accumulate quietly.
Short-Term Holder Metrics Show Seller Exhaustion
Bitwise’s European head of research, André Dragosch, highlighted that the short-term holder seller exhaustion metric is at its lowest level since August 2023. This metric typically reaches extreme lows when volatility is subdued but on-chain losses are high, signaling that sellers are tapped out.
Historically, similar conditions preceded upward volatility. For example, the previous instance led to a 190% BTC price surge from $25,300 in August 2023 to $74,000 in March 2024. The MVRV (market value to realized value) ratio also indicates that Bitcoin may have bottomed around $98,000 due to exhausted selling pressure.
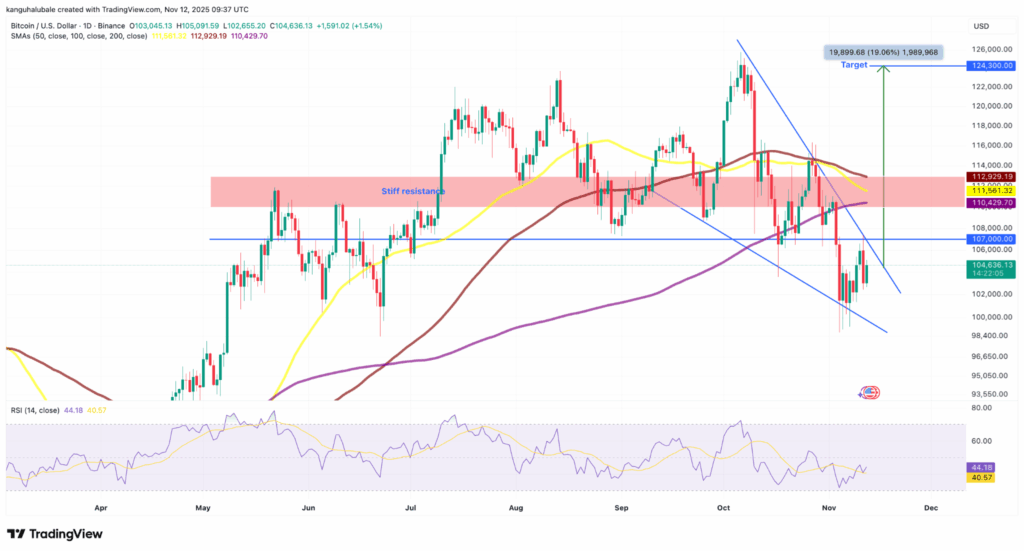
Falling Wedge Pattern Points to $124,000
On the daily chart, BTC/USD is trading within a falling wedge after rejection at the upper trendline near $107,000. Falling wedges are typically bullish reversal patterns. Analyst Mister Crypto observed on X:
“Bitcoin is trading in this falling wedge. The breakout is so close now.”
A daily close above $107,000 would confirm the pattern, potentially propelling BTC toward the wedge’s bullish target of $124,000—a roughly 19% increase from current levels.
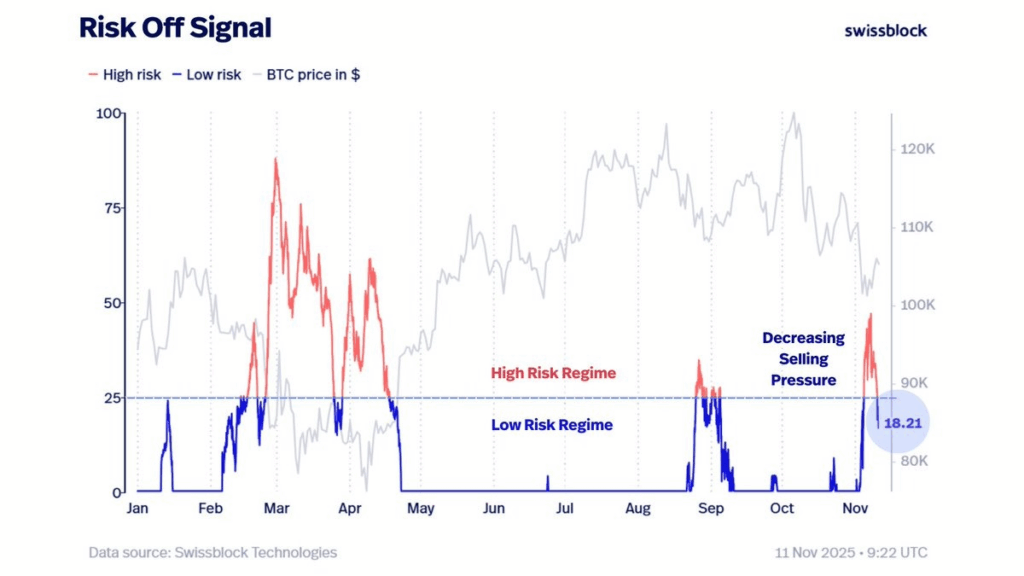
Swissblock, a private wealth manager, also noted:
“The Risk-Off Signal has shifted back to a low-risk regime, showing that selling pressure is easing as Bitcoin recovers. BTC now needs to reclaim $108.5K–$110K, confirming recovery as risk stabilizes and goes to 0.”


Comments are closed.