


Featured News Headlines
Bitcoin Price Reversal Imminent? On-Chain Data Suggests So
Bitcoin’s recent price dip may not be a signal of panic — rather, new on-chain data suggests long-term holders are standing firm while short-term profit-taking subsides. A potential shift in momentum could be underway, with key indicators showing signs of reaccumulation and a possible price reversal.
MVRV Z-Score Rises Slightly: Early Sign of a Shift?
The MVRV Z-Score, a widely followed metric that compares Bitcoin’s market value to its fair value, remains near its six-month low — but with a subtle upward movement that could signal an early turnaround.
As of October 17, the MVRV Z-Score had climbed from a three-month low of 1.90 to 1.96. While the increase is marginal, analysts often watch these “higher lows” closely.
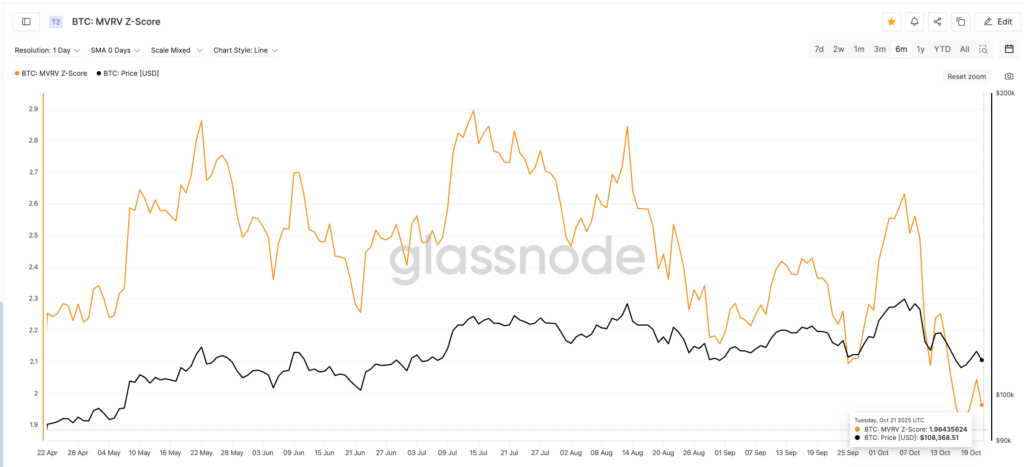
A similar move occurred between September 25 and 27, when the MVRV ticked up from 2.09 to 2.11. Within a week, Bitcoin’s price jumped nearly 14%, rising from $109,692 to $124,714.


This pattern may suggest that although sell-side pressure has cooled, long-term holders aren’t exiting the market — they’re holding steady through the volatility.
Spent Coin Age Bands Reveal Declining Sell Activity
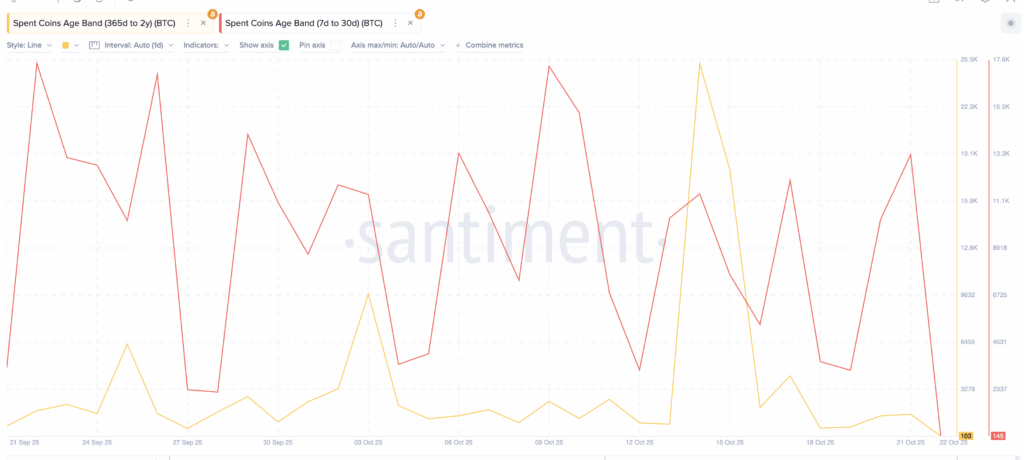
Further supporting this view is the Spent Coins Age Band metric, which tracks how much BTC is being moved by holders based on how long they’ve held their coins.
Between October 14 and 22, coins held for 365 days to 2 years dropped sharply — from 25,263 to just 103 BTC spent, a 99.6% decrease. Meanwhile, short-term holders (7–30 days) also showed reduced activity, falling from 13,273 to 145 BTC — a 98.9% drop in just 24 hours.
Together, these indicators suggest that:
- Long-term holders are not capitulating
- Short-term profit-taking is nearly exhausted
- Selling fatigue may be setting the stage for a rebound
Bitcoin Price Action Eyes Reversal Despite Seller Rejection
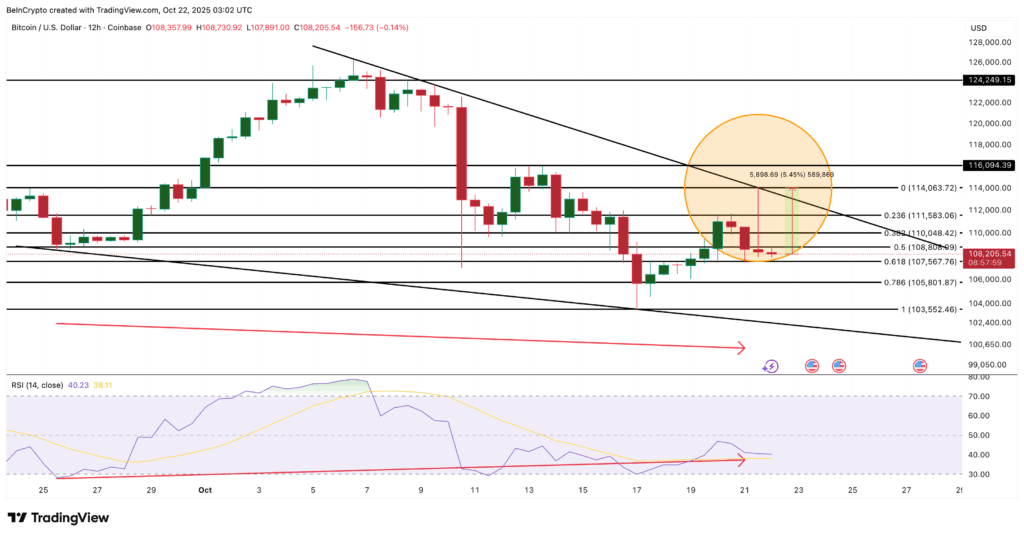
On the 12-hour chart, Bitcoin is still trading inside a falling wedge pattern — typically seen as a bullish reversal setup. BTC recently tested the wedge’s upper resistance near $114,000, but sellers stepped in, pushing the price back down to around $108,000.
A long upper wick on the candle revealed that sellers are still active. However, the appearance of a doji candle immediately afterward points to growing indecision — often the final stage before a breakout.
Adding to this, the Relative Strength Index (RSI) shows bullish divergence:
While BTC’s price made lower lows between September 25 and October 21, the RSI posted higher lows — a classic signal of weakening downward momentum.
If BTC breaks above $111,500, confirming a wedge breakout, it may target a quick move to $114,000. A strong daily close above that level could open the door to $116,000, with a potential extension toward $124,200 if bullish momentum accelerates.


Comments are closed.