


BTC Rebounds to $92K as Long-Term Wallets Accumulate
Bitcoin (BTC) traded at $92,534 at the time of writing, marking a 2.5% gain over the past 24 hours. The weekly range spans from $88,202 to $94,267, while the asset remains approximately 26% below its all-time high of $126,080 set in October.
Trading volume over the past day reached $46 billion, down 19%, reflecting reduced market activity after a highly volatile week. Derivatives volume also slipped 9% to $93 billion, while open interest rose 1.9% to $59 billion, suggesting traders are adding fresh contracts even as spot market activity cools. This indicates short-term participants may be waiting for a decisive move rather than exiting positions.
Accumulation by Long-Term Wallets
Long-term accumulation continues to shape Bitcoin’s market dynamics. CryptoQuant contributor Darkfrost highlighted that accumulation wallets have added 75,000 BTC between Dec. 1 and Dec. 10, with a notable 40,000 BTC purchased in a single day between Dec. 9 and 10. These addresses, now holding roughly 315,000 BTC, share characteristics such as infrequent outgoing transactions, consistent inflows, a minimum balance threshold, and at least seven years of activity.
Another CryptoQuant contributor, CryptoOnchain, pointed out unusual divergence on Binance. On Dec. 3, Bitcoin withdrawals’ 30-day estimated moving average hit 3,100 transactions, the highest since May 2018, while deposits fell to 320, the lowest since 2017. This supply squeeze suggests coins are moving off exchanges into self-custody, a setup historically associated with major bullish expansions.


Technical Landscape and Momentum
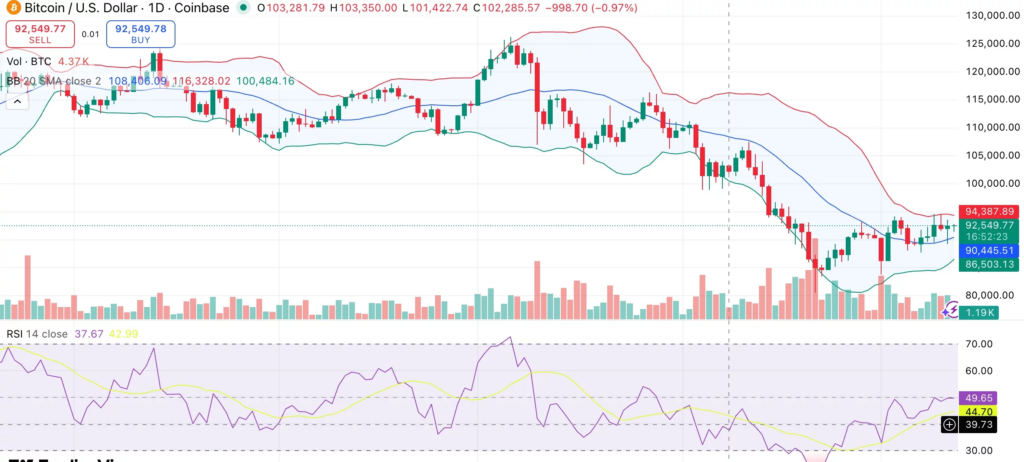
Bitcoin’s technical setup shows cautious optimism. The asset trades in the middle of the Bollinger Bands, below the upper band, indicating a partial recovery without full momentum. The 20-day moving average is guiding short-term buyers, while the relative strength index (RSI) at 49 reflects neutral market strength. Stochastic readings near 78 suggest indecision rather than exhaustion.
Price action above the 10-day and 20-day moving averages signals short-term support, while the 50-day, 100-day, and 200-day MAs remain above, underscoring that the broader trend is still in recovery.
A sustained close above $94,500 could pave the way toward $100,000, particularly if on-chain withdrawals remain strong. Conversely, failure to hold the $90,000–$91,000 range may trigger a pullback toward $86,500, aligning with the lower Bollinger Band and key liquidity zones.
The combination of supply absorption by long-term holders and cautious derivative positioning suggests the market is preparing for a potential expansion phase. Analysts and traders are closely monitoring on-chain flows and technical levels, as these factors often precede decisive price movements.


Comments are closed.