


Featured News Headlines
Ethereum Breakout Brewing as Long-Term Selling Collapses
Ethereum price has traded almost flat over the past week, frustrating analysts and traders who have been anticipating significant movement. On the surface, the market appears dormant, but a closer look at both technical charts and on-chain data tells a very different story. A clean breakout structure is emerging, while selling pressure from long-term holders has dramatically decreased—a rare combination that could set the stage for Ethereum’s next major move.
Inverse Head-and-Shoulders Breakout Signals Potential Upside
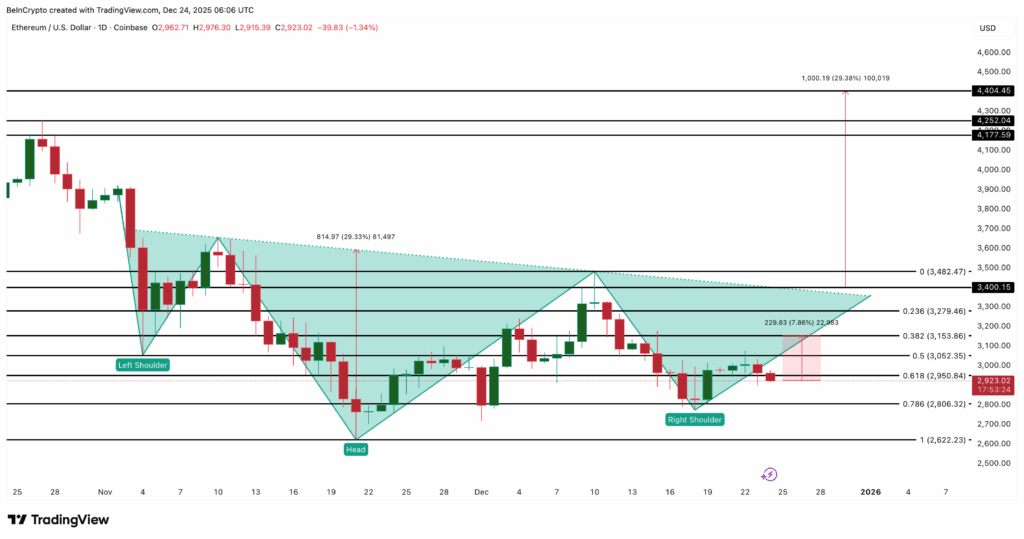
On the daily chart, Ethereum is forming a clearly defined inverse head-and-shoulders reversal pattern. The pattern features a relatively flat neckline around $3,400, a critical level for confirming a breakout. Flat necklines tend to produce stronger follow-through once the price breaks above, suggesting that any upward move could gain significant momentum.
If Ethereum closes decisively above $3,400, the pattern projects a measured target near $4,400, based on the height of the head in the reversal structure. From a purely technical standpoint, the setup is clean.
What makes this pattern even more compelling is what is happening on-chain.


On-Chain Data Shows Long-Term Sellers Stepping Back
The Hodler Net Position Change metric, which tracks whether long-term holders are buying or selling, has shifted sharply in Ethereum’s favor. On November 26, long-term holders were selling approximately 1.1 million ETH, but by December 23, that number had fallen to just 54,427 ETH.
This collapse in selling is significant. Historically, long-term holders tend to reduce sales near key market turning points. When a breakout pattern aligns with collapsing selling pressure, it signals that supply is drying up rather than increasing. Simply put, fewer sellers are standing in the way of a potential upward move, strengthening the likelihood of a breakout above the $3,400 neckline.
Cost Basis Levels Highlight Key Resistance Zones
To understand Ethereum’s realistic path toward the neckline, cost basis data provides valuable insight. Cost basis shows the price ranges where large amounts of ETH were last acquired, often acting as resistance zones as holders sell near breakeven.
For Ethereum, the most significant supply cluster sits between roughly $3,150 and $3,173, with around 2.94 million ETH accumulated in this range. This represents the strongest resistance wall on the way to the $3,400 breakout level. Clearing this zone would open the path toward the neckline, representing a potential 7% advance from current levels.
Beyond $3,400, the next notable resistance is around $3,480, followed by a relatively thin zone up to $4,170. If momentum builds after the breakout, the full inverse head-and-shoulders target of $4,400 could come into play.
Defined Risk Levels
While the outlook appears bullish, risks remain clearly defined. A drop below $2,800 would weaken the inverse head-and-shoulders structure, while a decline below $2,620 would invalidate the bullish setup entirely, suggesting that sellers have regained control.
For now, however, the technical and on-chain signals align toward the upside. A textbook reversal pattern, a sharp decline in long-term selling, and a clearly defined resistance map all point to the same conclusion—but a sustained move will depend on a clean close above $3,150, the key supply wall clearance zone.
Ethereum’s current price action may appear quiet, but the combination of a classic chart pattern, collapsing long-term selling, and key resistance levels suggests a potentially significant breakout. Traders and analysts watching the market should note the $3,150–$3,400 zone as the decisive range that could set Ethereum on a path toward $4,400, provided momentum sustains and supply walls are cleared.


Comments are closed.