


Featured News Headlines
Ethereum Price Shows Mixed Signals, MACD and RSI Indicate Consolidation
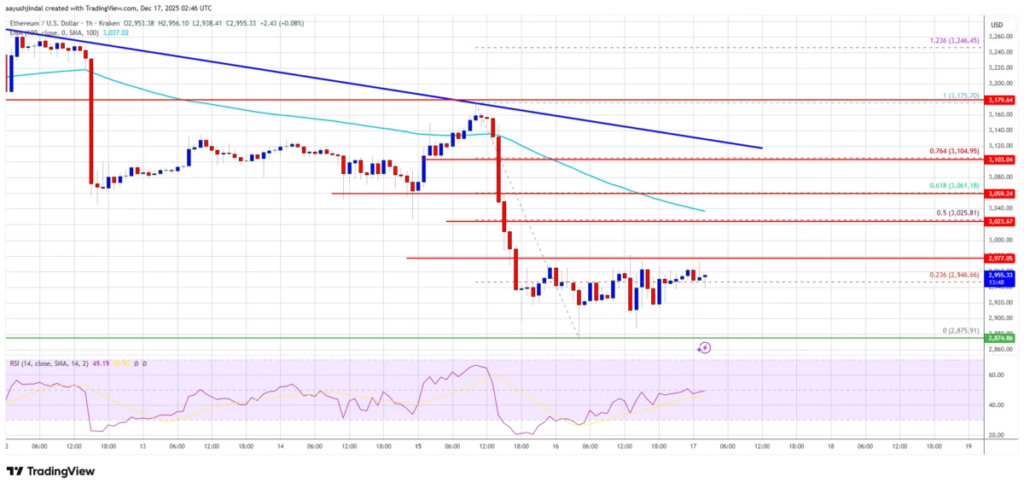
Ethereum (ETH) has entered a phase of consolidation after failing to maintain levels above $3,050, mirroring Bitcoin’s recent downward movement. Following a dip below $3,020 and $3,000, Ethereum entered a bearish zone, testing key support levels. The price even dropped under $2,920, forming a low at $2,875, before starting to stabilize and consolidate recent losses.
“A low was formed at $2,875 and the price is now consolidating losses,” analysts observed, highlighting Ethereum’s current indecisive trading phase.
Ethereum Faces Resistance Levels
Despite the recent drop, Ethereum saw a minor recovery toward the 23.6% Fibonacci retracement level of the downward move from the $3,175 swing high to $2,875 low. Currently, ETH is trading below $3,000 and beneath the 100-hourly Simple Moving Average (SMA), indicating short-term bearish pressure.
On the hourly chart, a connecting bearish trend line has formed with resistance around $3,110. Analysts note that if Ethereum attempts another upward move, the initial resistance is near $2,975, followed by $3,025, which aligns with the 50% Fibonacci retracement level.


“The first major resistance is near the $3,050 level. A clear move above this could send the price toward $3,110,” experts said.
Breaking above $3,110 could potentially trigger further gains, with Ethereum possibly rising toward $3,200 or even $3,250 in the short term. These resistance levels are being closely monitored for any signs of a stronger upward correction.
Downside Risks and Support Levels
If Ethereum fails to overcome the $3,025 resistance, a fresh decline could be initiated. The immediate support is around $2,920, followed by a major support near $2,900.
“A clear move below $2,900 might push the price toward $2,840, with potential losses extending to the $2,800 region,” analysts noted.
The next significant support sits at $2,765, which could act as a stabilizing level if bearish pressure persists. Ethereum’s short-term movement appears to be trapped between these critical support and resistance zones, indicating a period of consolidation.
Technical Indicators Show Mixed Signals
Hourly MACD – The MACD for ETH/USD indicates diminishing bearish momentum, suggesting that the recent downward trend may be losing some strength.
Hourly RSI – The Relative Strength Index (RSI) for ETH/USD hovers near the 50 level, reflecting a neutral market condition where neither bulls nor bears are fully in control.
These indicators collectively point to Ethereum entering a consolidation phase, where the market is balancing recent gains and losses, awaiting stronger directional signals.
Short-Term Outlook
Ethereum’s consolidation under $3,000 highlights the market’s current indecision. If the price can surpass the $3,025–$3,050 resistance range, it may test $3,110 and possibly higher levels near $3,200–$3,250. Conversely, failure to clear these resistance points could result in renewed downward movement toward $2,920, $2,900, and potentially $2,840.
“Technical indicators suggest Ethereum is in a consolidation phase, with key levels defining short-term movement,” analysts commented.
Investors and traders are advised to observe resistance and support zones, Fibonacci retracement levels, and hourly MACD and RSI indicators to assess Ethereum’s potential short-term trends. This period of consolidation may precede either a recovery or a continuation of bearish momentum, depending on how ETH interacts with its critical price levels.


Comments are closed.