


ASTER Price Momentum Shifts Following Early Buyback Program
Aster (ASTER) traded at $0.984 at press time, down 1.8% on the day. Over the past week, the token fluctuated between $0.9007 and $1.18, marking a 15% drop and sitting roughly 59% below its $2.41 all-time high from September 24.
Trading activity surged, with daily volume climbing to $556 million, a 62% increase. Derivatives activity also rose, as CoinGlass data shows ASTER derivatives volume up 31% to $1.27 billion, while open interest increased 3.6%, indicating that more traders are actively engaging during a volatile period.
Stage 4 Buyback Begins Ahead of Schedule
On December 2, Aster announced via X that Stage 4 of its buyback program had been activated eight days earlier than planned. The team stated that the early rollout aims to “support holders during unstable market conditions,” and the program immediately went live on-chain.
The program mirrors previous stages. Protocol fees continue to drive the buybacks, and depending on trading volume, up to 50% of purchased tokens may be burned. Across earlier stages, Aster has already repurchased 155.72 million ASTER, including 55.72 million in Stage 3, with 77.8 million scheduled for burning on December 5.


Community response has been positive, with one holder remarking:
“The early buyback proves the team is pushing real value, not empty promises.”
During periods of peak volume, the buyback engine has previously moved over $2 million per day, helping reduce circulating supply while supporting liquidity incentives and future airdrops.
Price Shows Signs of Recovery
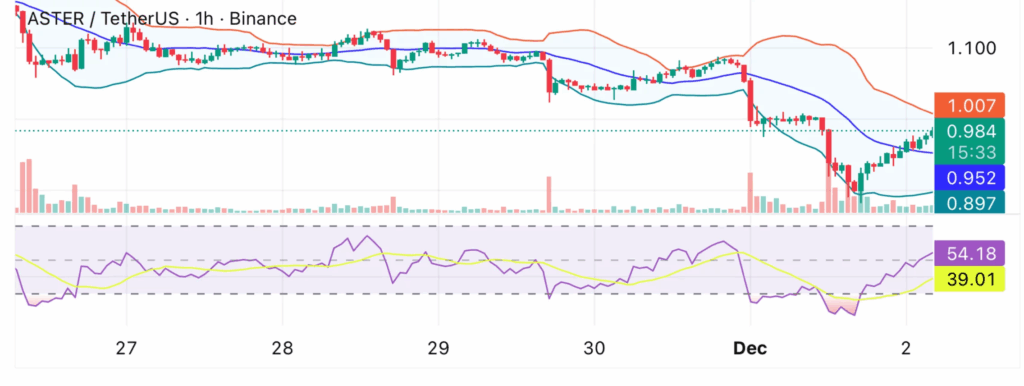
Aster’s price chart indicates a shift following a challenging end to November. A sharp drop brought the token to the $0.92–0.94 area, where buying volume increased. On December 1, the price broke out of a short-term descending structure and has since followed a gentle upward trajectory.
Momentum indicators hint at an early recovery. The Relative Strength Index (RSI) formed a bullish divergence, with the price making a lower low while the RSI made a higher low—a signal often seen at trend reversals.
The Stochastic RSI and Commodity Channel Index (CCI) also turned upward from oversold territory, reflecting stronger short-term momentum. However, the MACD remains negative and ADX is near 20, suggesting the upward trend is still forming.


Comments are closed.