


Bitcoin Price Correction Deepens: Is a Breakout Next?
Before rising above $103,603 at the time of publication, the price of Bitcoin had corrected about 4% over the previous day. Despite a 30-day drop of 7.39%, several market indicators currently point to a potential Bitcoin bottom. Additionally, it might help Bitcoin reach a new all-time high. The signals are more strongly clustered than they have been in recent weeks, although the structure has not yet been validated.
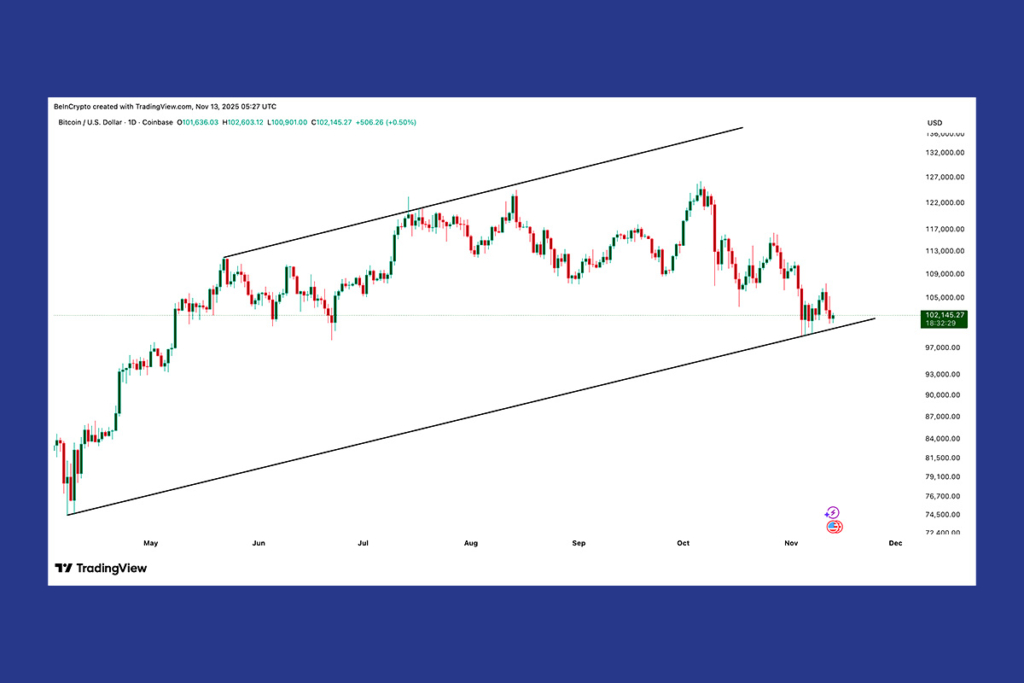
Traders Eye Bitcoin Bounce After Strong Channel Support Test
Since April, Bitcoin has been trading inside an ascending channel. Since early spring, the bottom trendline has served as dependable support. The channel is maintained by this line’s most recent rebound on November 4. The channel floor is typically where strength first emerges when bottoms form inside rising structures.
NUPL, a measure of whether holders are sitting on unrealized profit or loss, has also decreased to roughly 0.44. Since April 8, when NUPL reached 0.42 and indicated the precise cycle bottom, this is close to the lowest zone. Bitcoin then surged from over $76,700 to over $116,900 by the end of May. That is a nearly 53% increase. The same combination is now seen once more: NUPL returning to its historical bottom zone and a bounce off the channel floor. For this reason, traders believe a potential bottom is beginning to rise.
Strong BTC Supply Cluster at $110K Could Delay Recovery
The cost-basis heatmap displays the locations of the biggest Bitcoin supply pockets. Since many holders respond when the price returns to their entry levels, these pockets frequently prevent upside movements. Currently, one of the strongest clusters, supported by 117,078 BTC, is between $109,895 and $110,192. This zone has the deepest colors, especially in the short term, but there are other powerful BTC clusters before that.


At $109,683, one of the biggest technical resistance points on the Bitcoin price chart, that zone also coincides with the 0.618 Fibonacci level. The potential bottom cannot completely transform into a recovery until Bitcoin breaks through this band. Every bounce that falls below this threshold may eventually fall short. The first indication that the ridge is beginning to crack would be a daily closing above $109,683. Above $112,652, which corresponds to the 0.786 Fibonacci area, there is a more robust confirmation. Beyond that, Bitcoin may aim for $116,435 and possibly even the prior high of $126,301.
For more up-to-date crypto news, you can follow Crypto Data Space.


Comments are closed.