

Featured News Headlines
AAVE Technical Analysis: Range Breakdown Signals Bearish Trend
Aave [AAVE], one of the leading protocols in the decentralized finance (DeFi) sector, has recently been in the spotlight after its community approved a $50 million token buyback program.
The initiative allows the protocol to repurchase up to $1.75 million worth of AAVE each week, depending on its revenue and other operational metrics.
Since the buyback pilot launched in May, more than 94 million tokens worth over $22 million have been purchased. This deflationary approach, combined with a strong crypto market earlier this year, helped push AAVE prices to $385 in August.
However, that momentum has since weakened amid broader market uncertainty.


Bitcoin’s Drop Triggers Market-Wide Weakness
The latest downturn across the crypto market has weighed heavily on Aave’s performance. Following Bitcoin’s [BTC] slide below the critical $108,000 support level on November 3, AAVE’s price also declined sharply.
At the time of writing, AAVE was battling to hold above the psychological $200 level, with both bulls and bears locked in a tight contest — though selling pressure appeared to have the upper hand.
Futures Data Signals Continued Bearish Pressure
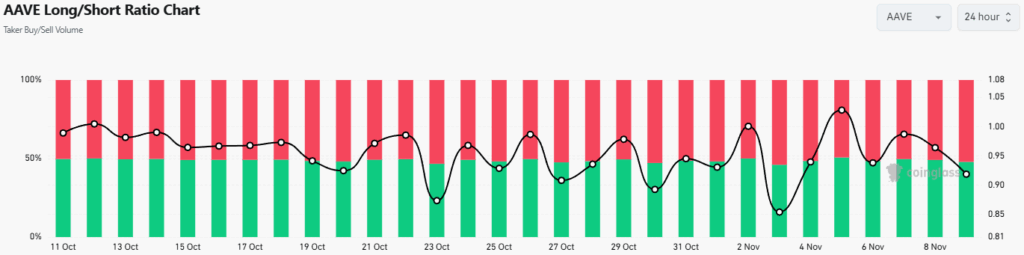
According to data from CoinGlass, AAVE’s Taker Buy/Sell Volume over the past month shows that buyer dominance has been rare. This indicates that bulls have struggled to overcome persistent selling activity.
At press time, the Long/Short Ratio stood at 0.918, reflecting higher taker sell volume.
This imbalance suggests that AAVE could face further downside pressure in the short term.
Technical Analysis: Breakdown Confirms Bearish Outlook
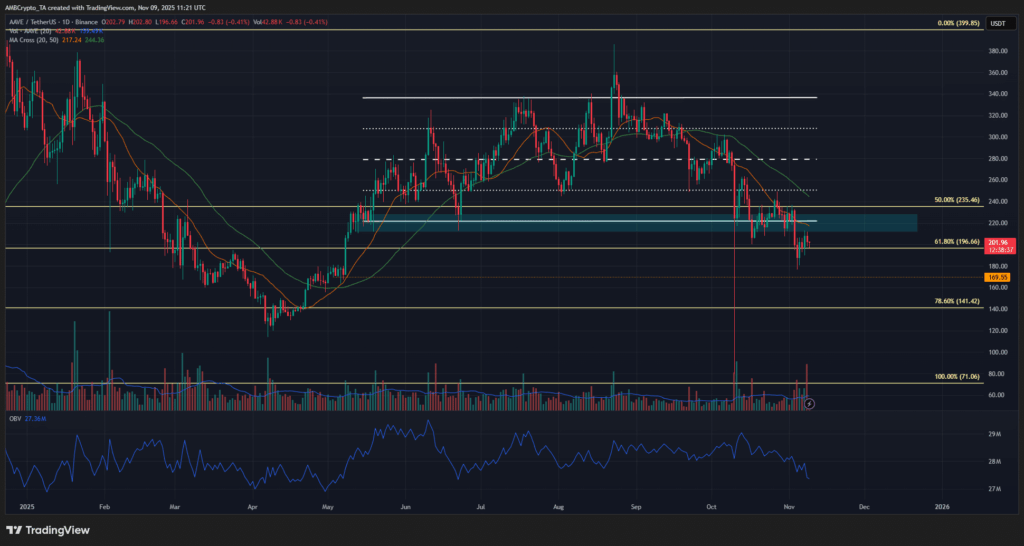
On the daily chart, AAVE has been in a consistent downtrend for over a month, recording lower highs and lower lows.
The bearish crossover between the 20-day and 50-day moving averages reinforces the negative momentum.
Since May, price action has shown a clear range formation between $221 and $336.
However, recent volatility pushed AAVE below the range low, turning the $210–$225 zone into a strong resistance area.
As of now, the market structure remains bearish, and a further 15% decline cannot be ruled out.
If selling pressure persists, the next key support levels to monitor are $170 and $141.


Comments are closed.