

Featured News Headlines
ETH ETF Inflows Surge as Price Stabilizes
Ethereum (ETH) fell by 5.3% in the past 24 hours, trading around $4,443 at the time of writing. Still, it remains up 7% on the week and 3.4% over the month. ETH currently sits just 10% below its yearly high of $4,946, recorded on August 24.
Volatility Signals Consolidation, Not Breakdown
Over the last week, ETH fluctuated between $4,133 and $4,748—suggesting a phase of consolidation rather than a reversal. Trading interest remains strong, with 24-hour spot volume climbing 27% to $51.9 billion.
Data from Coinglass reveals that Ethereum futures volume surged 54% to $124.2 billion. However, open interest declined by 5.5%, down to $60.3 billion, indicating a flush of leveraged positions—often a precursor to stabilization.
Institutional Demand Remains Strong via Spot ETFs
Despite recent price dips, net inflows into spot Ethereum ETFs continue. According to SoSoValue, $420 million in net inflows were recorded on October 7—marking seven consecutive days of positive ETF activity. Total Ethereum ETF assets now surpass $30 billion, with $803 million flowing in over the past month.


Analysts note that ongoing inflows from ETFs and corporate treasuries are helping to reduce circulating ETH supply. Exchange reserves have dropped to a three-year low of 17.4 million ETH, down from 28.8 million in 2022. Public firms now hold about 3.6 million ETH. Combined with the EIP-1559 fee burn mechanism, Ethereum’s supply dynamics are turning increasingly deflationary.
Price Levels to Watch
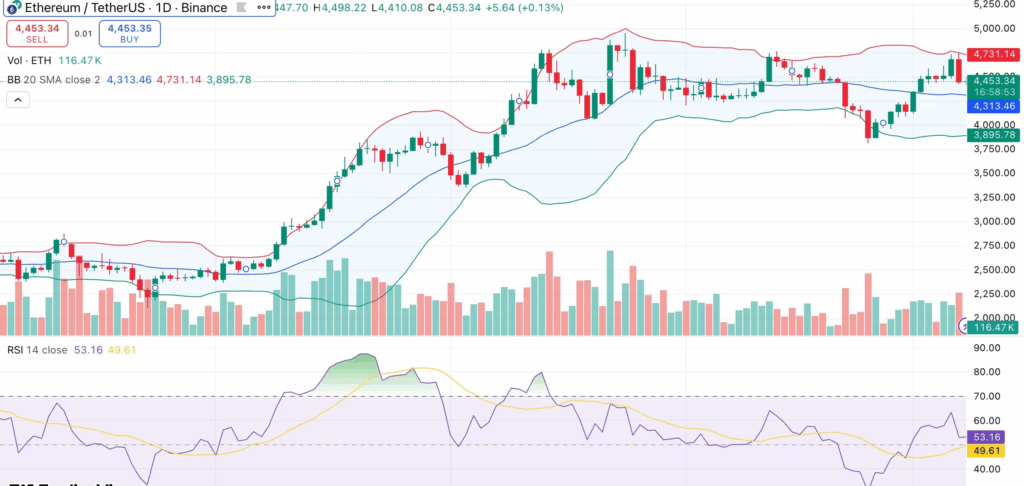
On the technical side, ETH is consolidating within the Bollinger Bands. Price action sits near $4,450—just above the middle band at $4,313, which acts as short-term support. The upper band, around $4,731, presents the next resistance level.
The Relative Strength Index (RSI) at 53 suggests neutral market momentum. If ETH breaks above $4,700, a retest of the $4,900–$4,950 zone is likely. A close below $4,300, however, could push the price toward $3,900, where the 50-day moving average aligns with the lower Bollinger Band.


Comments are closed.