


XRP Price: Breakdown or Bounce Ahead?
XRP Price– After weeks of upward momentum, XRP has fallen back below the $3 mark — but the real concern isn’t the round number. It’s the technical breakdown that’s now flashing caution for traders.
Mid-Bollinger Band Support Breaks
Since XRP’s breakout in July, the midline of the daily Bollinger Bands — around $3.19 — had acted as a consistent support during each pullback. That changed today. XRP has now closed below this level for the first time in the current rally, signaling a shift in short-term trend.
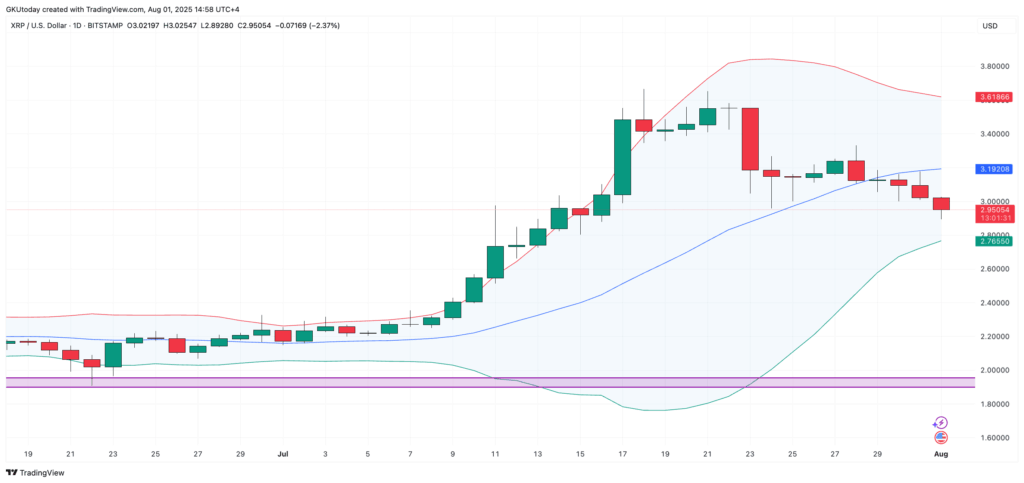
This mid-band typically separates bullish continuation from correction. With price slipping under it, XRP is now eyeing the lower Bollinger Band, currently near $2.76, representing another 6% potential downside.
At the same time, the Bollinger Bands are contracting, a classic signal of falling volatility and an incoming decisive move. Bulls have lost immediate control, and the next few days will be key.


Weekly Chart Shows More Downside Risk
Zooming out, the weekly chart isn’t catastrophic, but it’s softening. XRP is on pace for its second consecutive red candle, and the price has exited the upper band area — a sign of overextension now unwinding.
The key level to watch here is the weekly midline at $2.39 — a potential 20% drop from current levels if selling accelerates. While long-term support zones remain intact, a pullback to this zone would reflect a healthy but extended consolidation.
XRP isn’t collapsing — yet. But the once-clear uptrend has weakened. Until it can reclaim the 20-day average, this cooling phase could drag on longer than bulls expect.


Comments are closed.