


Triangle Pattern Signals Imminent Volatility
XRP is approaching a critical technical juncture as it nears the apex of a symmetrical triangle pattern—a setup that often precedes explosive moves in either direction. Over the next 10 days, price action is expected to accelerate, potentially defining XRP’s short-term trend.
Symmetrical triangles typically reflect market indecision. In XRP’s case, neither bulls nor bears have taken control, leading to a tight consolidation between $2.80 support and $3.10 resistance. As XRP trades around $2.95, the narrowing price range suggests growing pressure that could soon erupt.
Key Technical Indicators Remain Neutral
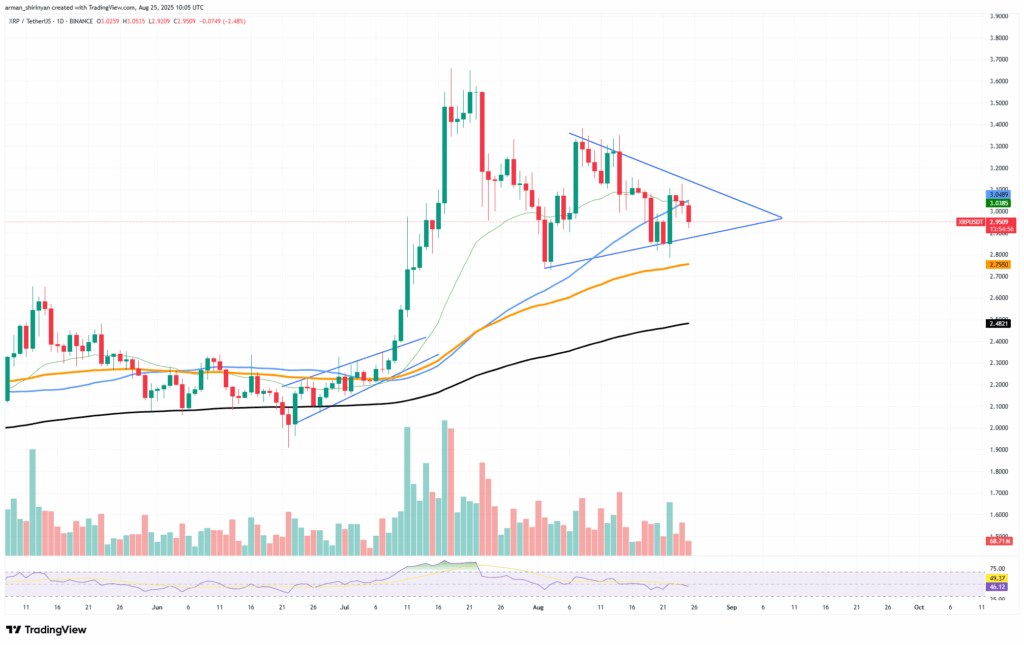
The Relative Strength Index (RSI) sits at 49, signaling a neutral stance. This reading implies that XRP is not overbought or oversold, aligning with the consolidation phase seen on the chart. However, declining trading volume adds complexity. While low volume is characteristic of triangle formations, a decisive breakout will require renewed trader participation.
Dynamic support levels are being provided by the 50-day and 100-day Exponential Moving Averages (EMAs), currently converging near the $2.75–$2.80 range. Meanwhile, the 200-day EMA remains significantly lower, underscoring the importance of maintaining current levels.


All eyes are now on the triangle’s boundaries. A confirmed breakout above $3.10 could open the door to a rally toward $3.30 or $3.50. Conversely, a breakdown below $2.80 may push XRP to retest the $2.70 level or dip further toward the 200-day EMA.
With only days left before price hits the triangle’s peak, a significant move is imminent. Whether that move is higher or lower will depend heavily on broader market sentiment.


Comments are closed.