


Featured News Headlines
XLM Price Analysis- Is $0.105 the Hidden Risk Zone for Stellar Investors?
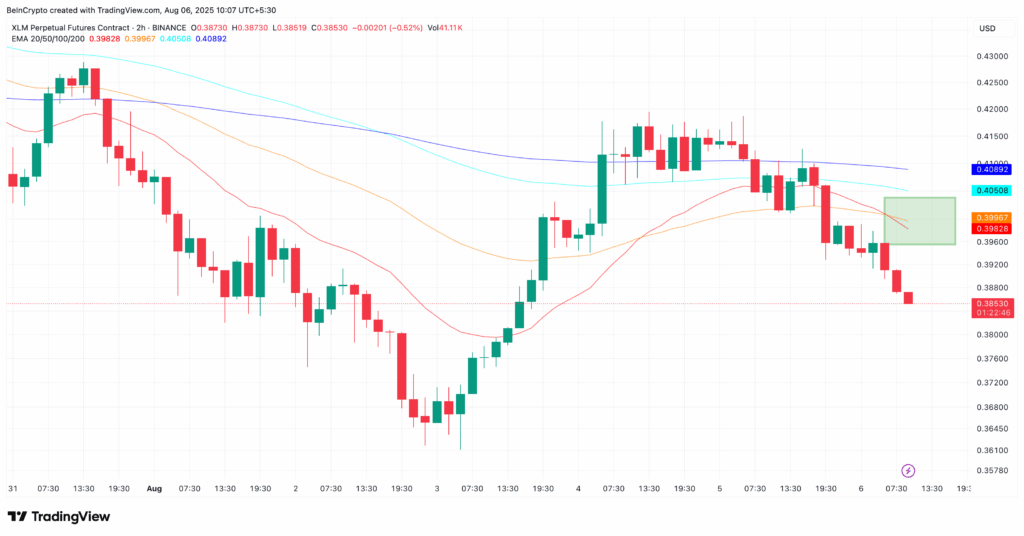
XLM Price Analysis– Stellar (XLM) is under growing pressure, with short-term technical signals pointing toward a potential pullback. A close look at the 2-hour chart reveals a classic “death crossover” as the 20-period EMA dips below the 50-period EMA. This crossover often signals rising selling momentum among short-term traders, warning that the recent downtrend may not be over yet.
Exchange Flows Signal Growing Selling Interest
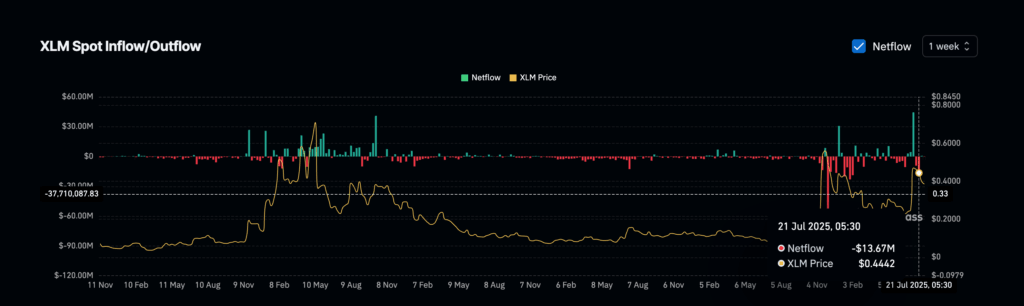
Adding weight to this bearish outlook, net exchange flows have shifted from slightly negative to positive this week. While the change might seem small, it’s significant — more tokens are moving onto exchanges, which often hints that holders are preparing to sell, increasing downside risk for XLM.
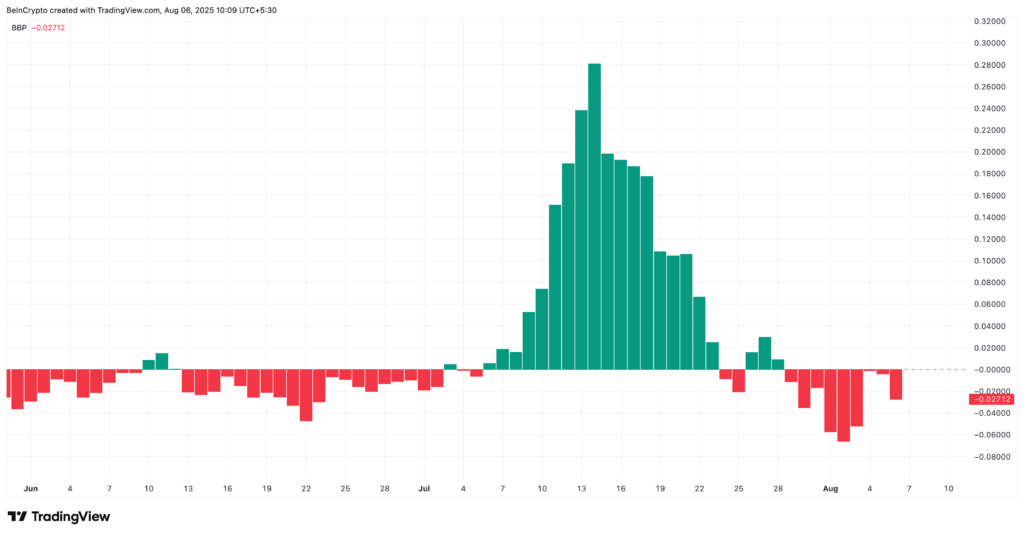
Market Sentiment Confirms the Bearish Bias
Sentiment indicators like the Bull-Bear Power (BBP) index have sharply tilted in favor of the bears recently, showing that sellers are gaining control. Furthermore, over 60% of traders currently hold short positions on XLM, reflecting widespread expectations of further price declines. Though a heavily shorted market can sometimes trigger a squeeze, current trend and price action suggest sustained bearish momentum for now.
Key Support and Resistance Levels to Watch
Right now, Stellar trades just above $0.37 — a critical support zone. A drop below $0.37 could open the door to a deeper sell-off toward $0.33, and potentially as low as $0.28 if the next support fails. On the flip side, bulls need to defend $0.37 and push XLM above $0.40 and $0.45 to challenge the bears. A decisive break above $0.52 would be needed to confirm a fresh bullish trend. Until then, caution is warranted as Stellar remains vulnerable.


Comments are closed.