

Featured News Headlines
SOL Price Action- Solana Shows Bullish Signs Despite Broader Market Uncertainty
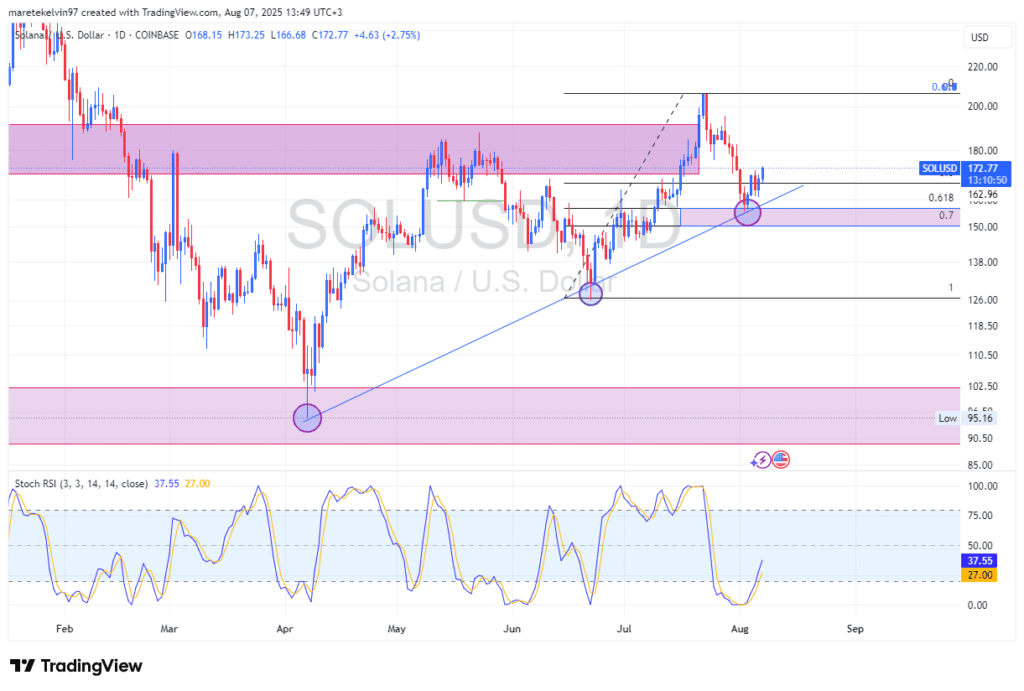
SOL Price Action– Solana (SOL) has bounced from a significant technical confluence zone, where ascending trend-line support intersects with the golden Fibonacci retracement levels between 0.618 and 0.7. This technical pattern often indicates potential price recovery.
The Stochastic RSI indicator shows oversold conditions, suggesting SOL may have reached a local price bottom. When combined with the support bounce, these technical factors typically precede upward price movements in trending markets.
Whale and Retail Activity Shows Alignment
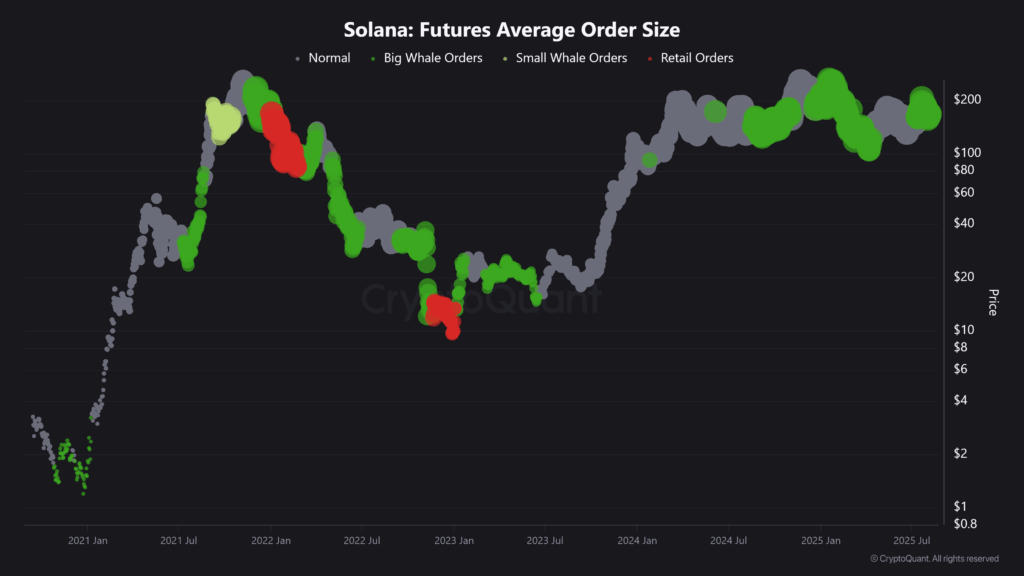
On-chain data reveals coordinated accumulation across different investor segments. CryptoQuant’s Future Average Order Size data indicates whale addresses are actively accumulating SOL at current price levels.
Retail investor activity has also increased significantly, particularly in positions under $1 million. This simultaneous accumulation from both large and small investors suggests underlying market strength, especially when supported by positive technical indicators.


Key Resistance Level at $206
The next significant price target for SOL is $206, which represents the recent local high where selling pressure previously dominated. This level will serve as a crucial test for any potential breakout attempt.
If the current accumulation trend continues, with whale support providing price stability and retail inflows adding momentum, SOL may attempt to break above this resistance level.
Market Context and Outlook
While broader market conditions and Bitcoin’s performance will influence SOL’s price action, the combination of technical recovery signals and positive on-chain metrics indicates strengthening bullish sentiment.
The alignment between technical analysis showing oversold conditions bouncing from support, and on-chain data revealing coordinated accumulation, provides a foundation for potential price advancement toward the $206 resistance level.


Comments are closed.