


Featured News Headlines
- 1 Shiba Inu Technical Analysis: Head-and-Shoulders Pattern Warns of Further Decline
- 2 Funding Rates Turn Negative: A Bearish Signal
- 3 Exchange Supply Rises, Whale Activity Stalls
- 4 Trading Volume Trails Behind Other Meme Tokens
- 5 Technical Indicators Reflect Bearish Momentum
- 6 What Could Come Next
- 7 Key Insights at a Glance
- 8 Why This Matters
Shiba Inu Technical Analysis: Head-and-Shoulders Pattern Warns of Further Decline
Shiba Inu (SHIB) dropped approximately 3.65% on Monday, August 19, dipping to a low of $0.00001263. This move echoed broader cryptocurrency market turbulence, as Bitcoin and many altcoins tumbled. With investor sentiment waning, SHIB now faces multiple pressure points.
Funding Rates Turn Negative: A Bearish Signal
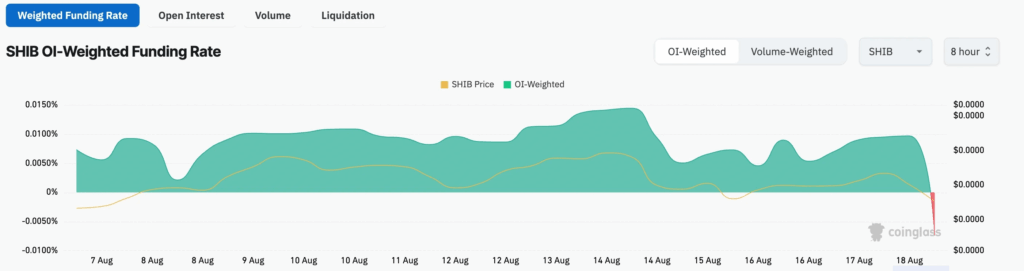
Data from CoinGlass reveals SHIB’s futures funding rate has fallen to –0.0074%, hitting its lowest point in months. In perpetual futures markets, when funding rates flip negative, short-sellers pay longs—signaling growing expectations that future prices will underperform spot prices.
Exchange Supply Rises, Whale Activity Stalls
SHIB’s exchange supply—tokens held on trading platforms—jumped by over $1.15 million on Monday. This reflects renewed selling interest, the highest transfer volume in over two weeks. At the same time, whale and smart-money holdings remain stagnant: approximately 61.7 billion SHIB since August 6, with whale holdings steady at 45 billionthroughout the month. These patterns suggest larger investors are choosing to wait on the sidelines—or quietly offload assets.
Trading Volume Trails Behind Other Meme Tokens
Daily trading volume for SHIB has fallen to roughly $204 million, considerably lower than comparable meme tokens such as Pepe, Dogwifhat, and Floki. This disparity points to softer trading activity and weaker engagement in the SHIB market.


Technical Indicators Reflect Bearish Momentum
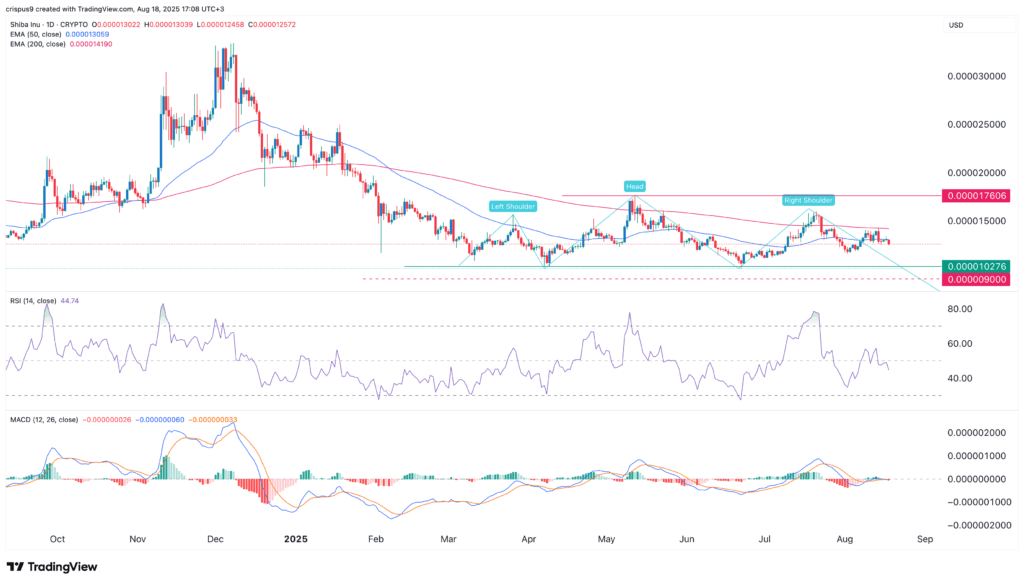
On the daily chart, SHIB trades below both the 50‑day and 200‑day exponential moving averages (EMA), typically a bearish configuration. Price formation appears to resemble a head‑and‑shoulders pattern—commonly seen as a trend reverser. In this formation:
- Left and right shoulders sit around $0.00015
- The neckline lies near $0.00001027
Furthermore, the Relative Strength Index (RSI) has dipped below its neutral 50 level, while the MACD (Moving Average Convergence Divergence) hovers near zero. Together, these indicators suggest momentum is fading and bearish continuation is possible.
What Could Come Next
Should SHIB break beneath the neckline at $0.00001027, the path may open toward deeper losses. A sustained move below that level would likely reinforce bearish sentiment, potentially triggering further downside.
Key Insights at a Glance
- SHIB slid about 3.65%, touched $0.00001263 low on August 19
- Funding rate turned negative at –0.0074%, signaling bearish futures sentiment
- Exchange inflows rose sharply—highest token movement in 2 weeks
- Whale holdings stagnant (~61.7B total, ~45B whales) since early August
- Daily volume slumped (~$204M), lagging behind meme rivals
- Below 50‑day & 200‑day EMAs, showing bearish trend strength
- Head‑and‑shoulders pattern formed; neckline at $0.00001027
- Indicators (RSI below 50, MACD at zero) hint at weakness ahead
Why This Matters
For SHIB holders and watchers, these converging signals—funding rate negativity, stagnant big‑holder activity, weakening volume, and technical warning patterns—paint a cautious picture. If the bears maintain control, a move past the neckline could intensify selling pressure. Meanwhile, the lack of fresh buying interest or bullish catalysts leaves open the possibility of further price compression.


Comments are closed.