

Report Flags Litecoin as a Strong Legacy Contender
A new Silver Standard report argues that Litecoin (LTC) may be one of the most undervalued legacy cryptocurrencies in the current market. The analysis points to the Proof-of-Work network’s 14-year uninterrupted uptime, a steadily rising hash rate, and deep market liquidity as evidence of fundamental strength.
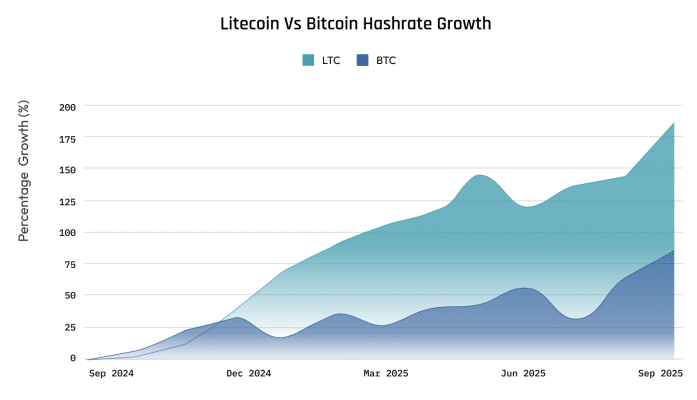
The report also compares Litecoin’s hash rate growth with Bitcoin’s (BTC), revealing that LTC’s percentage increase demonstrates notable technical resilience. According to the authors, this reinforces Litecoin’s long-term adoption potential—and leaves room for what they describe as “meaningful price expansion.”
Technical Compression Hints at a Major Move
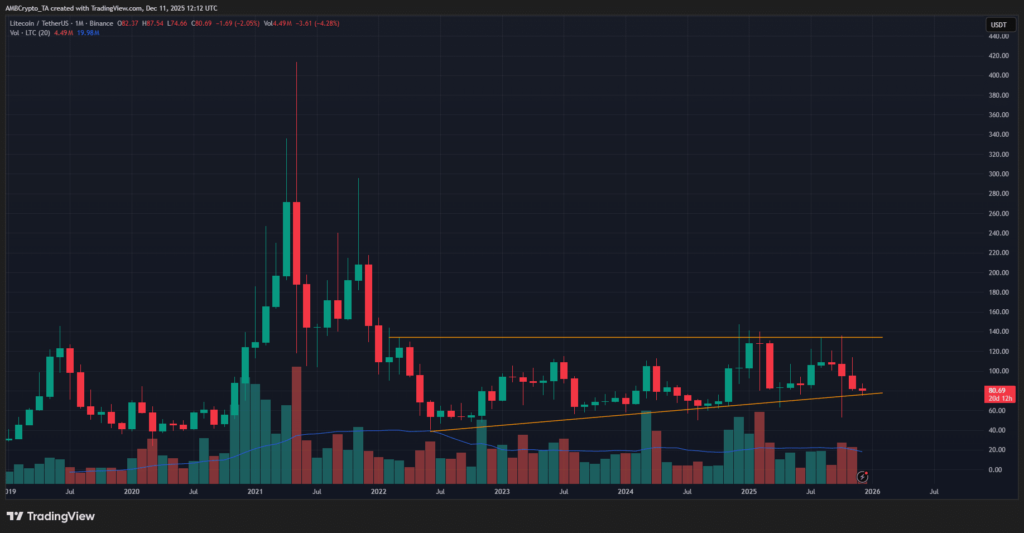
A multi-year compression pattern visible on the monthly chart aligns with this narrative. Historically, such patterns tend to resolve sharply as the price coils tightly before breaking out.
If Litecoin rallies from this structure, the long-term target highlighted is a retest of its all-time high near $410.


On the weekly timeframe, Litecoin is hovering around a significant support zone at $82, the same level that triggered a strong rally in June and produced a bullish weekly structure shift. The area also represents the Value Area Low (VAL) for 2025, based on the Fixed Range Volume Profile.
The Accumulation/Distribution (A/D) indicator continues trending upward, hinting that buyers may eventually gain control despite recent selling pressure.
However, momentum signals tell another story. The MACD shows strong bearish momentum, while the daily chart confirms a bearish structure. For swing traders, analysts note that the $88 supply zone must flip into support before any bullish reversal can be taken seriously.
Bearish Scenario Still on the Table
Market signals remain mixed. The lack of a decisive bullish response for nearly a month around the $80 region suggests that this price level is currently being accepted by traders. Analysts note that if buyers truly viewed LTC as “discounted,” a stronger reaction would likely have appeared already.
A breakdown below the $75–$80 range would reinforce a bearish continuation scenario.
For now, the path forward remains unclear. A move above $88 would indicate early signs of an uptrend, while a break below $75 could confirm renewed downside momentum. Until one of these levels gives way, experts suggest that waiting for clearer market confirmation may be the most reasonable approach.


Comments are closed.