


Featured News Headlines
Bitcoin Price Action Forms V-Shaped Recovery Pattern
Bitcoin (BTC) is currently trading at $113,355, about 5% above its recent local low of $108,650. Several on-chain and technical indicators are now signaling that this level may have marked the short-term bottom for BTC, potentially paving the way for a new phase of accumulation and upward momentum.
Dormancy Flow Metric Signals Accumulation Phase
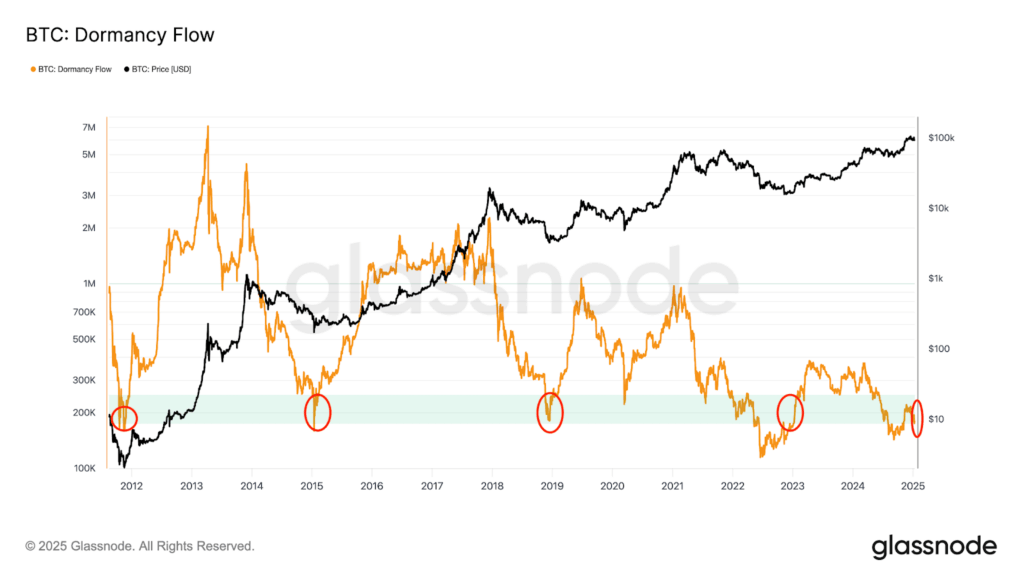
One key on-chain indicator attracting attention is the entity-adjusted dormancy flow, which measures the relationship between Bitcoin’s current market capitalization and the annualized dormancy value (expressed in USD).
According to historical data, whenever this metric drops below 250,000, it typically signals a “good historical buy zone.” Past dips into this zone have often preceded major price reversals or marked the end of correction cycles. On Thursday, the indicator reached a low of 133,300, well beneath that threshold.
“Historically, breakouts above 250,000 after a dip coincide with the start of strong bull runs,” analysts noted, referencing BTC’s rally from July 2021 that led to the all-time high of $69,000 by November that year.


With the dormancy flow once again flashing bullish, Bitcoin’s current price level around $114,000 could act as a launchpad for a move back toward record highs.
SOPR Drops Into Bottoming Zone
Another metric supporting the bottoming narrative is the Spent Output Profit Ratio (SOPR), which has recently declined to 1.5. Historically, this zone has aligned closely with local market bottoms, as it reflects a point where most coins are being spent at or below their cost basis — indicating capitulation or loss realization by short-term holders.
As previously reported by Cointelegraph, dips in SOPR often suggest that selling pressure is exhausting, setting the stage for potential recovery as stronger hands re-enter the market.
Short-Term Holders Show Capitulation
Further reinforcing the potential bottom is the behavior of short-term holders (STH). The Net Unrealized Profit/Loss (NUPL) metric for STHs has turned negative, indicating stress and loss among those holding BTC for less than 155 days.
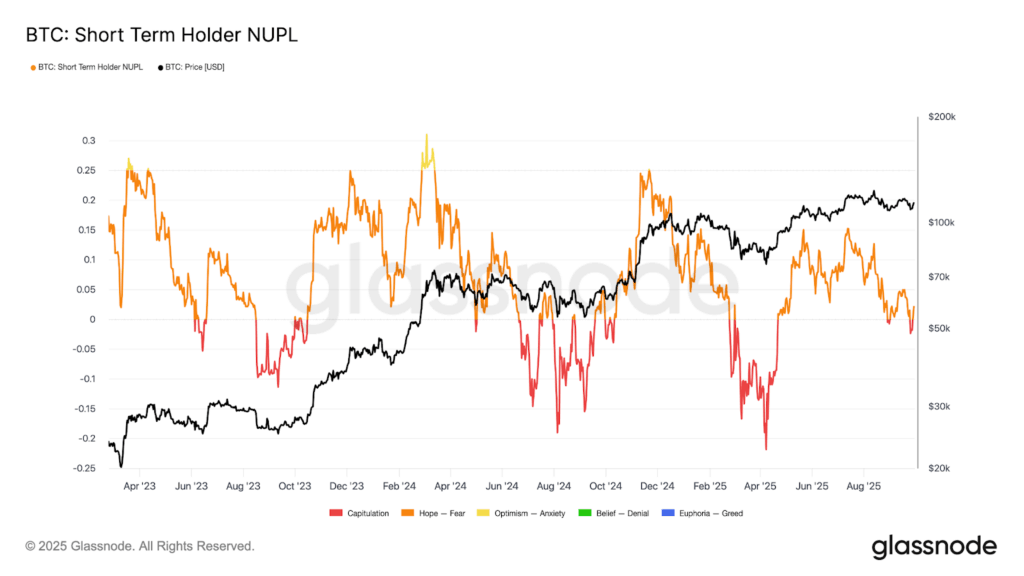
On-chain analytics platform Glassnode shared in a recent post on X (formerly Twitter):
“STH capitulation events have historically marked periods of market reset, often laying groundwork for renewed accumulation.”
Crypto analyst Jack echoed this sentiment, writing:
“History says this capitulation zone often marks local bottoms. The setup screams early accumulation.”
The most recent instance of negative STH-NUPL was seen near April 2025, when BTC fell below $75,000. That low preceded a 65% rally that eventually took the BTC/USD pair to an all-time high of $124,500.
Technical Patterns Support Rebound Scenario
Beyond on-chain data, technical analysis also points toward bullish reversal potential.
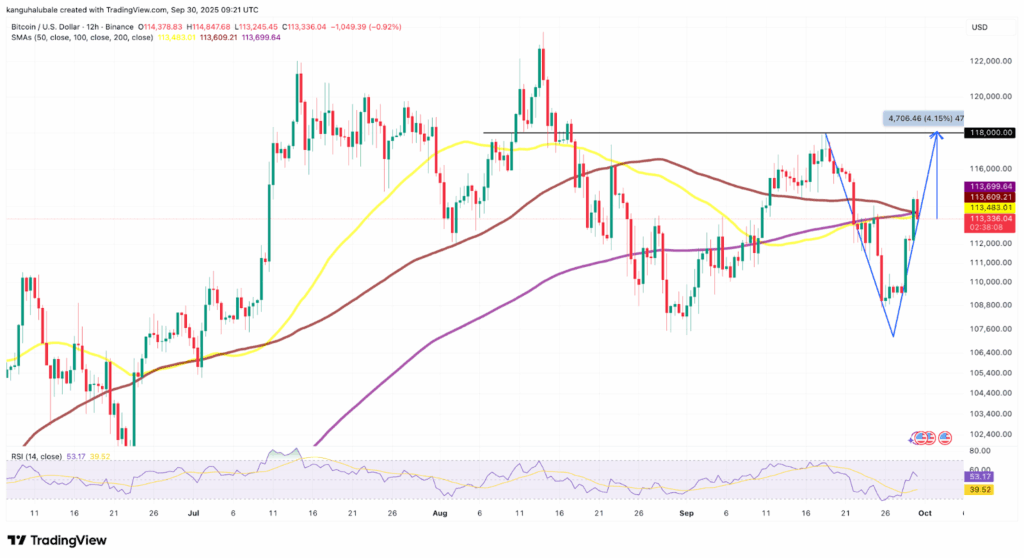
Since September 18, BTC’s price has carved out a V-shaped recovery pattern on the 12-hour chart. After dropping 7.8% to the low of $108,700, strong buyer interest drove a sharp rebound to current levels.
The Relative Strength Index (RSI) climbed from an oversold 27 to 53, indicating improving momentum. If the V-pattern completes, BTC could test the neckline resistance at $118,000, implying a 4% upside from current levels.
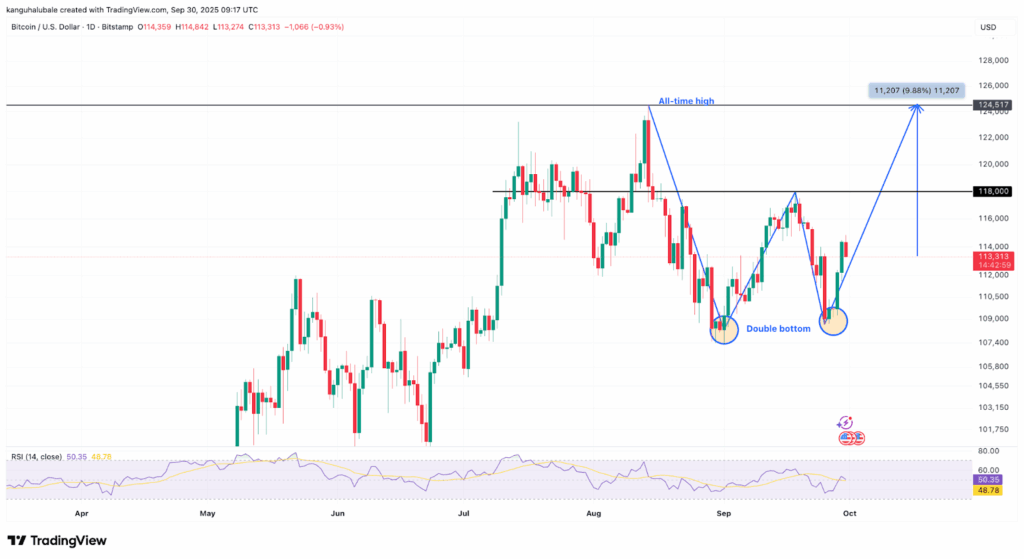
Zooming out to the daily chart, a double bottom formation also suggests potential for a return to the all-time high of $124,500, should BTC break through the key resistance zone. This would represent a 10% gain from the current price point.
Market Structure Remains Technically Bullish
According to crypto analyst Matthew Hyland, Bitcoin’s current market structure is:
“Just clean,” referring to the ongoing double bottom and a potential breakout from an inverse head-and-shoulders pattern.
These bullish formations are emerging as Bitcoin enters Q4, historically a strong period for BTC, especially following halving cycles.


[…] for long entries. According to a recent analysis published by CryptoPotato, ETH is forming an inverse head-and-shoulders and a bullish wedge on longer timeframes. Traders who anticipate a breakout above $4,500 are […]