


Featured News Headlines
HBAR Price Signals Accumulation Near Key Support
While the daily chart of HBAR still reflects a fragile market structure, multiple short-term indicators are beginning to challenge the bearish narrative. Signals from both the 4-hour and daily charts suggest that buyers may be gradually regaining control, even as caution remains warranted in the near term.
4-Hour Chart: Signs of Accumulation Appear
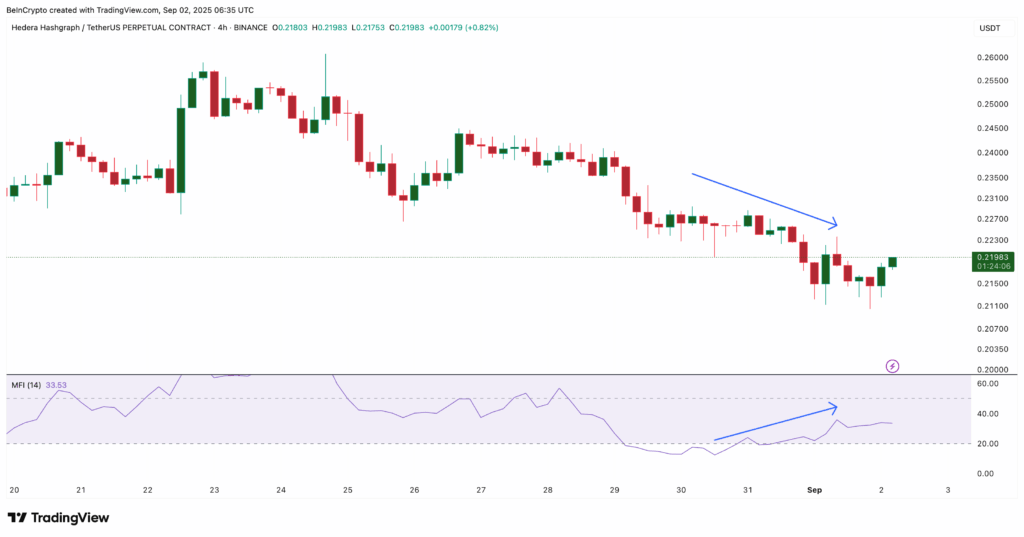
On the 4-hour timeframe, several early technical signals hint at a possible shift in momentum. One of the standout indicators is the Money Flow Index (MFI), which monitors capital flows in and out of an asset. Over the past several sessions, the MFI has been printing higher highs, despite the fact that the HBAR price has continued to decline — a classic sign of bullish divergence between price and volume-based indicators.
This divergence suggests that capital is quietly rotating back into HBAR, even though this buying activity has yet to manifest on the higher daily timeframe. If the MFI manages to break above 35.90, its recent swing high, it could confirm that accumulation is underway and potentially precede a more visible recovery in price.
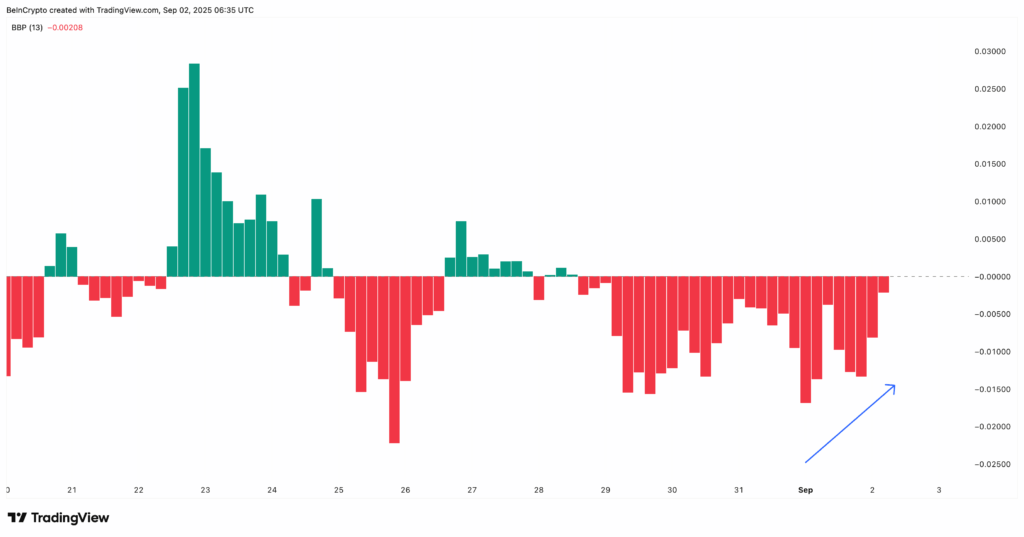
Adding further context, the Bull–Bear Power (BBP) indicator — which measures the balance of buying and selling pressure — has been gradually declining since September 1. While this may initially seem bearish, it actually signals a reduction in selling momentum, implying that the dominance of bears is weakening as dip-buyers slowly return.


“Together, these 4-hour signals suggest that while HBAR price is not out of the woods yet, the tide may be turning.”
Daily Structure Still Fragile, But Divergences Are Forming
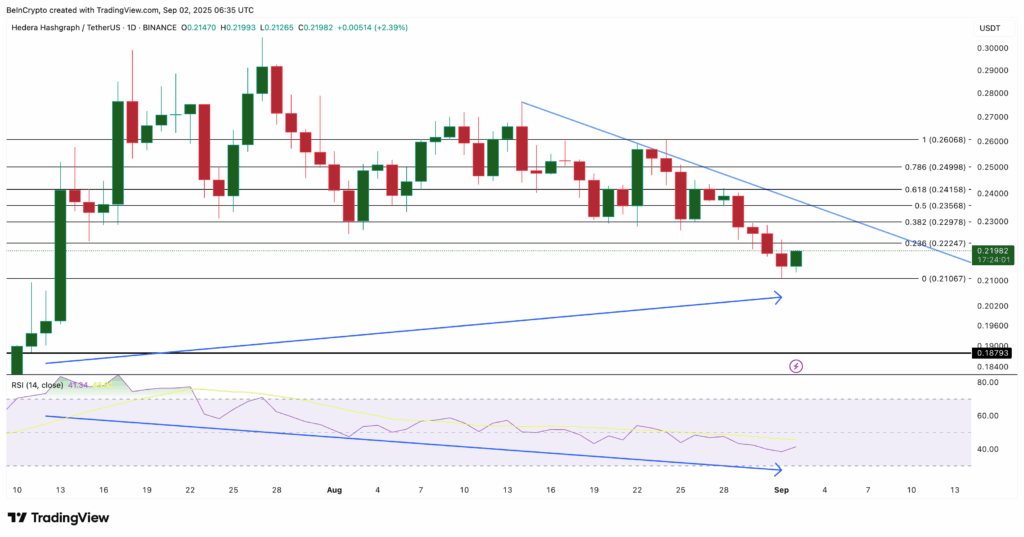
On the daily chart, HBAR remains confined within a descending triangle pattern, a structure typically associated with bearish continuation — but not without its nuances.
Price action is currently hovering near a key support zone at $0.210. This level has acted as a crucial line in the sand. A decisive break below this support could open the door to further downside, with the next potential target at the $0.187level — an area that coincides with a deeper Fibonacci retracement level from HBAR’s larger move up earlier this year.
However, not all is bearish. Between July 13 and September 2, a hidden bullish divergence has emerged. While the price chart has carved a higher low, the Relative Strength Index (RSI) has formed a lower low. This hidden divergence — where momentum weakens while price stabilizes — often indicates that the underlying trend may resume after a temporary correction.
Given that HBAR has recorded 330% gains over the past year, this technical setup aligns with the idea that the broader bullish trend remains intact, even if short-term volatility persists.
Key Levels to Watch: $0.210 Support and $0.235–$0.249 Resistance
Looking ahead, the $0.210 support remains a critical line to defend. A successful hold of this level, especially with confirmation from continued volume inflows on shorter timeframes, would strengthen the case for a reversal.
On the upside, reclaiming the $0.235–$0.249 resistance zone would be the first strong technical signal that the downtrend is losing strength and that buyers are beginning to challenge recent bearish structure. This area has previously acted as a supply zone, and clearing it could attract renewed momentum from both short-term traders and long-term holders.
“If buyers defend $0.210 and reclaim $0.235–$0.249, this divergence could be the spark for a sustained rebound and even a rally if the broader market conditions align.”
A Cooling Phase Within a Larger Bullish Cycle?
Zooming out, it’s important to recognize that HBAR’s recent pullback occurs within the context of a larger bullish macro trend. After gaining over 330% year-to-date, a phase of cooling, consolidation, and profit-taking is not only expected but healthy for long-term price stability.
The presence of hidden bullish divergence, combined with declining selling pressure on intraday charts, could suggest that this correction is nearing exhaustion. Whether that results in a sharp rebound or a slower bottoming process remains to be seen, but technically speaking, the early signs of accumulation are present.


Comments are closed.