


Featured News Headlines
Daily Chart Analysis
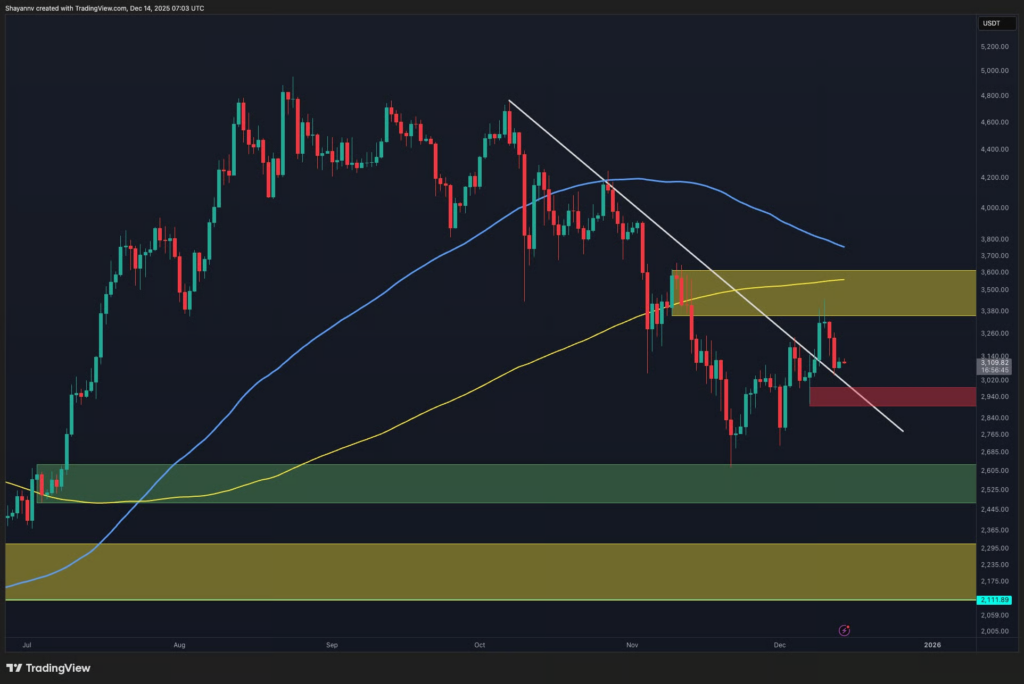
On the daily timeframe, Ethereum (ETH) continues to trade below a dominant descending trendline that has capped price action since its November peak. According to the analysis, “each recovery attempt has stalled beneath this structure, reinforcing the broader corrective bias.”
Currently, ETH is hovering around the $3,100 level, below both the 100-day and 200-day moving averages. The 200-day moving average, near the $3,400–$3,500 zone, coincides with a major daily supply area that has historically attracted selling pressure.
The most significant resistance lies in the $3,300–$3,600 range. A sustained daily close above this zone would be necessary to invalidate the descending trendline and hint at a potential trend shift. On the downside, the $2,500–$2,600 demand area remains the strongest support, representing the origin of earlier bullish impulses and aligning with the broader market structure.
4-Hour Chart Observations
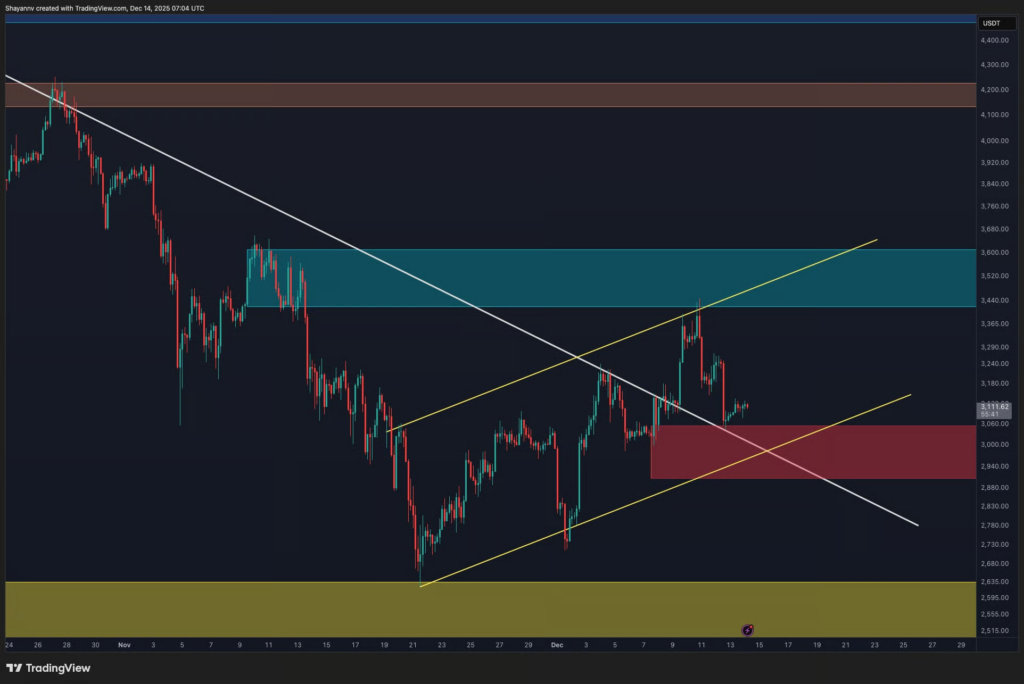
On the 4-hour chart, ETH is trading inside a rising corrective channel embedded within the larger downtrend. Short-term higher lows have formed, yet price action remains capped by the descending trendline and a local supply zone around $3,300–$3,400.


“Recent price action shows repeated rejections from this resistance cluster, followed by shallow pullbacks rather than impulsive continuation,” the analysis notes. If ETH fails to reclaim $3,300 with strength, the next focus for downside liquidity lies near the psychological $3,000 level, followed by $2,900. A breakdown from the rising channel could increase the likelihood of a deeper move toward the daily demand zone.
On-Chain Liquidity Analysis
According to Shayan’s on-chain study of the Binance ETH/USDT liquidation heatmap, a dense cluster of liquidation levels exists above the current price, primarily between $3,400 and $3,700. This concentration suggests a high number of short positions in that range, which could attract the price if sufficient momentum emerges.
Below current levels, liquidation density is thinner, with the next significant cluster forming around $2,600–$2,700. This imbalance implies that downside moves may face less resistance in the short term, potentially triggering a liquidity sweep before any sustained upward movement.

Market Structure Implications
Historically, Ethereum tends to move toward zones of concentrated liquidation once momentum aligns. Presently, the structure and liquidation profile indicate that ETH may need to clear weak long positions to the downside before meaningful upward momentum can develop. Until the higher liquidation clusters are engaged, ETH remains susceptible to continued corrective or range-bound action rather than a decisive bullish breakout.


Comments are closed.