


Featured News Headlines
ETH Price Holds Key Multi-Year Trendline Amid Market Moves
Ethereum (ETH) is once again interacting with a trendline that has played a pivotal role in its price action for nearly ten years. Historically, this level has acted as a key turning point in multiple market cycles.
Current Price and Market Activity
At the time of writing, ETH is trading around $3,000, with a 24-hour trading volume of $14.6 billion. Over the past seven days, Ethereum has gained approximately 7%, despite a minor dip over the last 24 hours, according to CoinGecko data.
Multi-Year Support Under Review
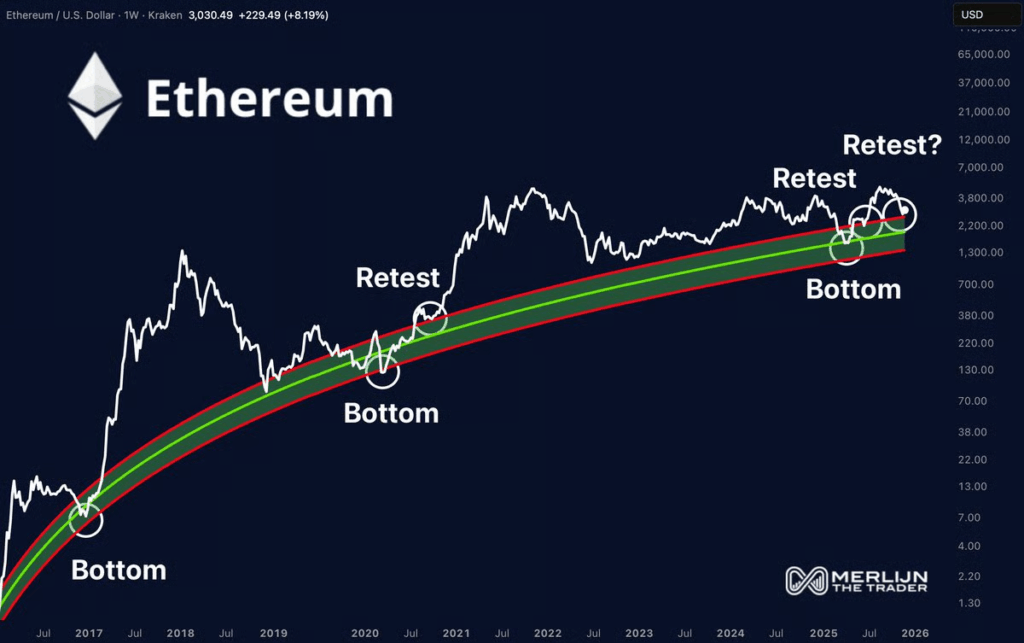
Charts shared by Merlijn The Trader indicate that ETH is moving within a green support zone that has served as a foundation since 2016. Previous cycles in 2017 and 2020 followed a clear pattern: a cycle low, a retest of the support, and then a significant upward move. Ethereum’s current price action appears to mirror this historical trend. Notably, this trendline has remained unbroken since its formation nearly a decade ago.
Technical Indicators Highlight Momentum Shift
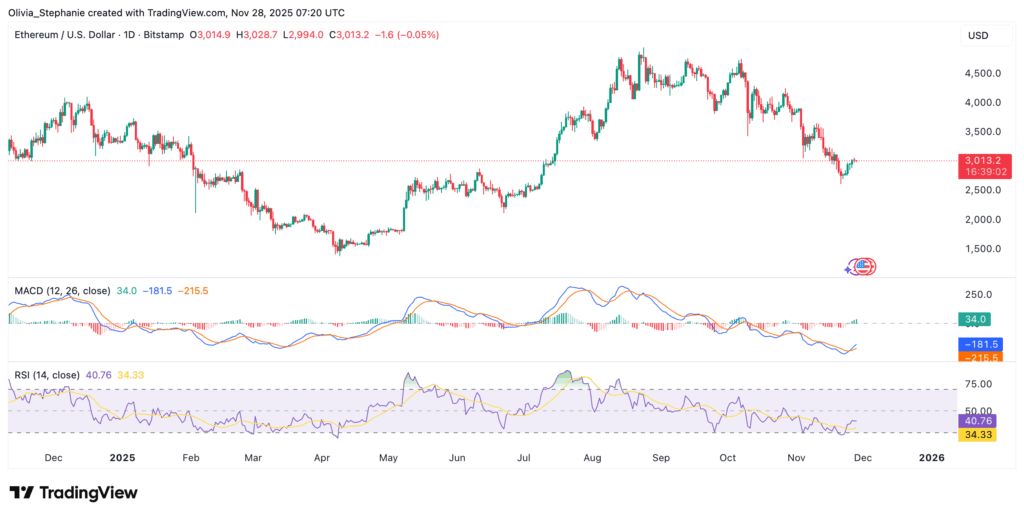
The daily Relative Strength Index (RSI) is at 40.76, below the neutral 50 line but showing recovery from previous lows. This suggests that short-term bearish pressure may be easing, signaling a potential stabilization in momentum.


Whales Absorb Selling Pressure
A liquidity heatmap shared by Merlijn shows significant buy interest between $2,750 and $2,850. Ethereum recently tested this zone and rebounded, indicating that large holders may be absorbing selling pressure during this movement.


Comments are closed.