


Featured News Headlines
ETH Price Analysis: Demand Weakens Near Resistance Zone
Ethereum [ETH] maintained its dominant position in the crypto developer ecosystem through 2025, with Solana [SOL] trailing closely in second place, according to a recent AMBCrypto report. The data revealed a strong correlation between the two networks, especially in terms of new and active developer counts.
While developer momentum remains high, on-chain investor behavior adds another layer of bullish sentiment—but not without caution.
Exchange Outflows Suggest Investor Confidence
Ethereum has seen a notable decline in exchange-held supply, a potential sign of long-term investor conviction. On Binance, the ETH Exchange Supply Ratio dropped to 0.033, hitting a multi-month low. This metric implies more users are shifting their ETH holdings into self-custody wallets, a common behavior among long-term holders.
Additionally, positive sentiment grew after Bhutan’s National Digital Identity initiative announced its integration with the Ethereum blockchain, further validating ETH’s role as an infrastructure layer for real-world applications.


Weekly Chart: Bullish Structure Holding, But Momentum Wanes
A look at Ethereum’s weekly chart shows a bullish swing structure, with the price moving from $1,385 to $4,798. Key Fibonacci retracement levels highlight the $4,000 region as a critical demand zone, supported by a bullish breaker block (marked in cyan).
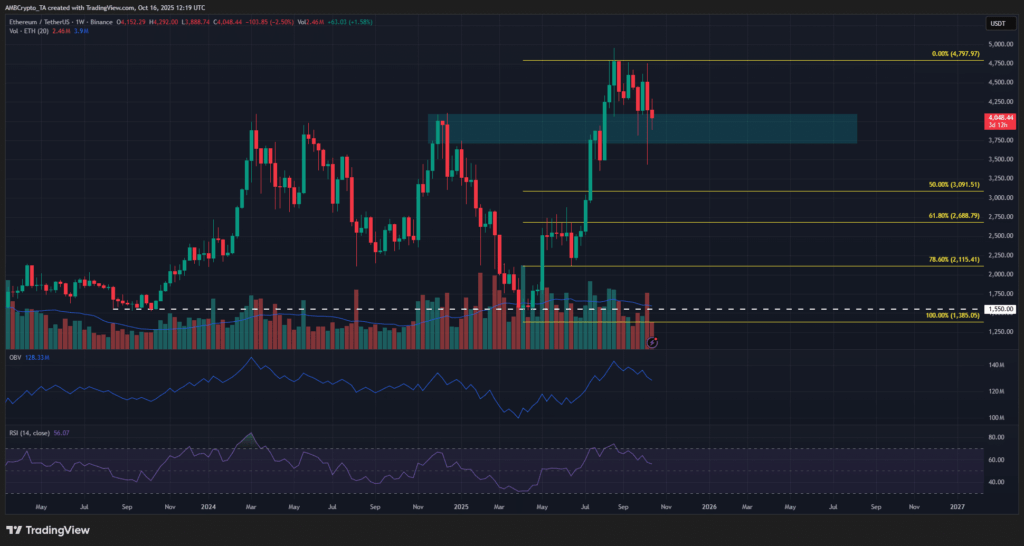
However, there are signs of weakening momentum:
- The On-Balance Volume (OBV) has dropped below the highs of December 2024, suggesting a slowdown in buying pressure despite the price holding near $4,000.
- The Relative Strength Index (RSI) is also hovering below the neutral 50 mark, further pointing to lackluster momentum.
“The weekly price has yet to close below $4,000, but the declining OBV is a warning sign that demand may be fading,” noted the report.
A weekly close below $3,712 would be a red flag, potentially confirming bearish strength and setting up a deeper pullback toward $3,100.
Daily Chart: Resistance Ahead at $4.2K–$4.4K
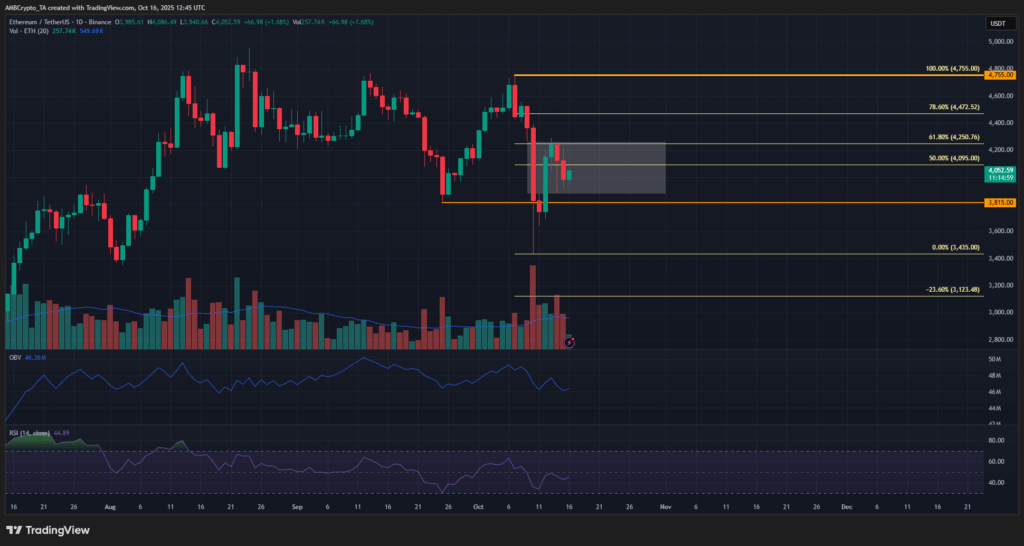
The daily structure has turned bearish after ETH slipped below $3,815, invalidating its short-term bullish setup. A price imbalance around $4,200—highlighted by a white box—has already been filled, reducing the chance of a quick rebound.
Importantly, the $4,250 level aligns with the 61.8% Fibonacci retracement of the recent downward move, creating a strong resistance zone.
Unless bulls can sustain support above the key $4,000 level, upward momentum may continue to fade. A clean drop below $3,900 could trigger a move toward $3,400 in the near term.


Comments are closed.