


Featured News Headlines
Ethereum Breaks Above $2,950 Amid Rising Momentum
Ethereum price has recently demonstrated a notable upward move, following a trend similar to Bitcoin. ETH successfully surpassed key resistance levels at $2,920 and $2,950, signaling entry into a positive zone. Market observers noted that the bulls managed to push the price above the 61.8% Fibonacci retracement of the downward move from the $3,175 swing high to the $2,775 low.
Ethereum’s price even surged past the $3,050 resistance zone, though selling pressure reappeared near $3,080. Despite this, the cryptocurrency remains in a rising trajectory, with current trading above $2,980 and the 100-hour Simple Moving Average (SMA) providing additional support.
Hourly Chart Analysis and Rising Channel
Technical charts show that Ethereum is forming a rising channel, with support currently around $2,975 on the hourly chart. This pattern suggests that the near-term trend remains upward, though short-term resistance levels may impact the pace of gains.
“If Ethereum continues to hold above $2,980 and the 100-hour SMA, the next targets could test higher resistance zones,” analysts indicate. Observers point to the $3,050 level as the first potential barrier to upward momentum, with a key resistance at $3,080, corresponding to the 76.4% Fibonacci retracement of the recent decline.


Key Resistance Levels and Potential Upside
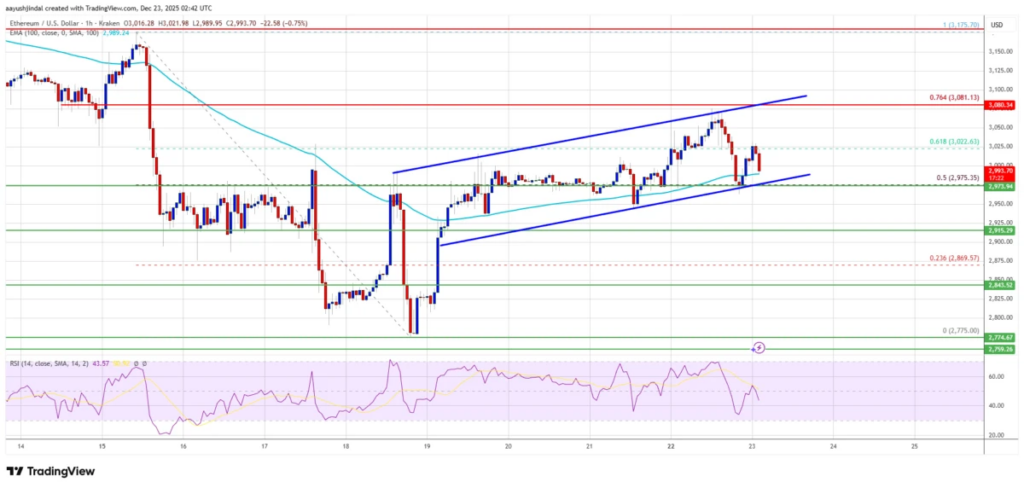
Beyond $3,080, Ethereum could encounter the next significant resistance around $3,150. A clear break above this level might pave the way for additional gains toward $3,220. In a scenario where bullish momentum persists, Ether could reach $3,250 or even $3,265 in the near term.
Technical analysts emphasize that a sustained breakout above these levels could signal a continuation of the short-term upward trend. The combination of rising channel formation, SMA support, and recovery above critical Fibonacci retracement levels all contribute to a cautiously optimistic outlook.
Possibility of a Short-Term Decline
While Ethereum shows signs of upward momentum, a failure to surpass the $3,080 resistance may trigger a corrective move. Initial support on the downside lies near $2,980, followed by the trend line acting as a dynamic support level.
If downward pressure intensifies, the first major support is identified around $2,915. Analysts note that a breach below $2,915 could expose Ethereum to further declines toward $2,840, with an additional support zone at $2,800. The next critical support remains at $2,775, coinciding with the previous swing low.
Technical Indicators and Market Sentiment
Ethereum’s near-term price action reflects the ongoing tug-of-war between bulls and bears. The rising channel indicates short-term strength, while Fibonacci retracement levels provide reference points for potential reversals.
Traders and analysts watch for sustained trading above $2,980 and the 100-hour SMA, which could maintain the bullish bias. Conversely, repeated rejections at $3,080 may lead to consolidation or a short-term decline, emphasizing the importance of monitoring key support and resistance zones.
Short-Term Outlook
Ethereum remains in a dynamic trading range, with potential to test multiple resistance levels if bullish momentum persists. Key levels to watch on the upside include $3,050, $3,080, $3,150, and $3,220, while downside protection exists at $2,980, $2,915, and $2,840.
Market participants note that the overall trend remains positive as long as the rising channel and SMA support hold, yet volatility around $3,080 could shape short-term price movements. Analysts suggest closely observing the interaction between price action and Fibonacci retracement levels, which have historically acted as significant turning points in Ethereum’s price trajectory.


Comments are closed.