


Ethereum Slides 10% in 30 Days — Can Bulls Bounce Back?
Ethereum (ETH) is currently trading around $3,857, reflecting a modest decline of 0.2% over the last 24 hours. Over the past week, the token has swung between $3,709 and $4,183, contributing to a 6% drop for the week and about a 10% decline over the past 30 days. Notably, the coin remains about 21% below its August peak of roughly $4,946.
Despite what looks like a weakening price performance, several metrics suggest renewed interest in the market. According to CoinGlass data, 24‑hour trading volume surged by 35.2% to $45.8 billion, while derivatives volume jumped 57.3% to $114.2 billion. Open interest in futures and options edged up 0.6% to $43.8 billion, indicating that, even as prices drop, traders are beginning to rebuild positions.
One compelling thread is the return of flows into spot Ethereum exchange‑traded funds (ETFs). After three straight days of outflows, U.S. spot ETH ETFs recorded $141.6 million in net inflows on October 21, according to data from SoSoValue. Major funds such as Fidelity’s FETH led with $59.07 million, followed by BlackRock’s ETHA at $42.46 million. Grayscale’s Mini ETH and ETHE also saw inflows of $22.58 million and $13.14 million, respectively. Crucially, none of the listed ETFs had net outflows that day. The renewed capital infusion could signal short‑term support for ETH — particularly if the trend continues through the latter part of October.
Investors are also eyeing the upcoming Federal Reserve Open Market Committee (FOMC) rate decision scheduled for October 28–29. Markets are pricing in a roughly 95% probability of a 25‑basis‑point rate cut. Should the Fed deliver a dovish signal, risky assets like cryptocurrencies may enjoy a surge in liquidity. Conversely, a hawkish stance could reignite macroeconomic headwinds and dampen momentum.


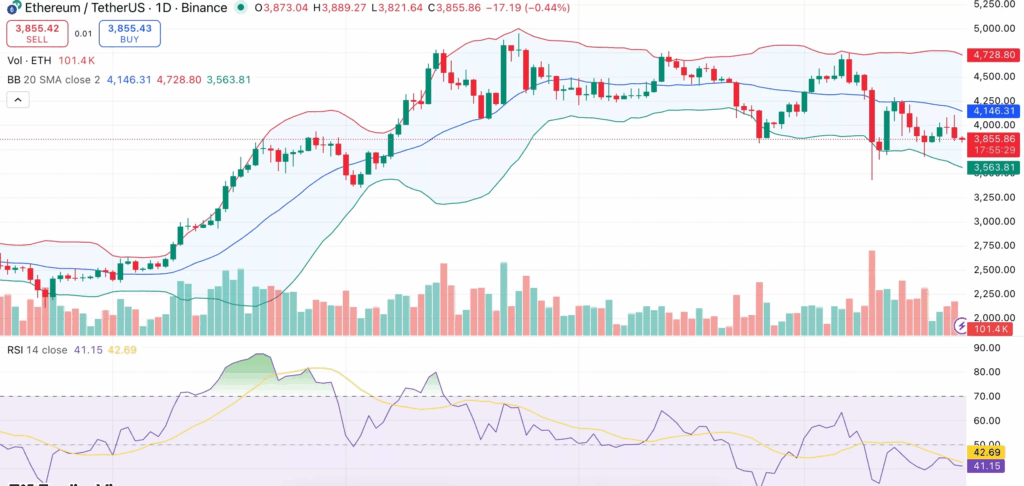
On the technical front, Ethereum’s chart reveals a mix of compression and caution. On the daily chart, ETH trades below the Bollinger Band midline near $4,146, with resistance positioned around $4,720 and support close to $3,563. The narrowing bands suggest a “squeeze” phase — a common precursor to a significant move, either up or down. The Relative Strength Index (RSI) currently sits at approximately 41.15, which does not yet signify oversold conditions but does hint at bearish tilt. A rebound in the RSI toward the 45–50 range could confirm a recovery; conversely, a drop below 40 might trigger further downside.
Moving average indicators add nuance. Short‑term exponential moving averages (10‑, 20‑, 50‑ and 100‑day EMAs) are flashing sell signals, reflecting the short‑term weakness in trend structure. However, the 200‑day EMA remains lower at around $3,570, which suggests the longer‑term uptrend is still intact — at least for the moment.
Scenario‑wise, if ETF inflows continue and macro conditions stay favorable, Ethereum may gain traction above $3,900 and could retest the $4,350–$4,500 range. On the flip side, if inflows slow or macro sentiment worsens, a break below $3,800 could expose $3,563 support — or even slide toward $3,400.
It is worth highlighting that the divergence between volume and price suggests that while selling pressure has eased somewhat, buyers have yet to fully dominate. The uptick in futures and derivatives volumes indicates participants are repositioning. Meanwhile, ETF flows point to renewed institutional interest — which could act as a tailwind if sustained.
One of the key themes to monitor in the coming days is whether inflows into spot ETH ETFs maintain momentum. These capital flows can alter supply dynamics in the open market. Coupled with upcoming macro events — particularly the Fed’s interest‑rate signal — and technical patterns showing a squeeze, the environment is poised for a potential directional breakout.
However, caution remains appropriate. The current price levels are still not far from technical support, and the broader market backdrop remains uncertain. While the longer‑term trend has not been broken, the near term is clearly fragile. For now, market watchers will be watching three main levers: ETF inflows, Fed policy signals and whether Ethereum can reclaim higher support/resistance levels on the chart.
In summary, Ethereum is navigating a complex juncture: price momentum has weakened, but structural signs of accumulation and capital interest are reappearing. Whether those underlying signals translate into a renewed rally or a deeper consolidation will depend on the combination of flow‑based demand and macro‑technical triggers. At this stage, the coin remains positioned for a potential rebound — though the path is neither certain nor straightforward.


Comments are closed.