Featured News Headlines
Bitcoin Volatility Alert: Short-Term Holders Accumulate Amid Market Uncertainty
Bitcoin (BTC) is entering the November monthly close precariously positioned below the $90,000 mark, leaving traders and investors to gauge whether the cryptocurrency is on the cusp of a modest rebound—or further downside.
BTC Eyes Recovery Amid “Death Cross” Concerns
Following last week’s local low of $80,500, Bitcoin remains highly uncertain. Data from Cointelegraph Markets Pro and TradingView shows that $88,000 currently acts as a key resistance level. Traders remain divided, balancing long-term bearish predictions with cautious optimism.
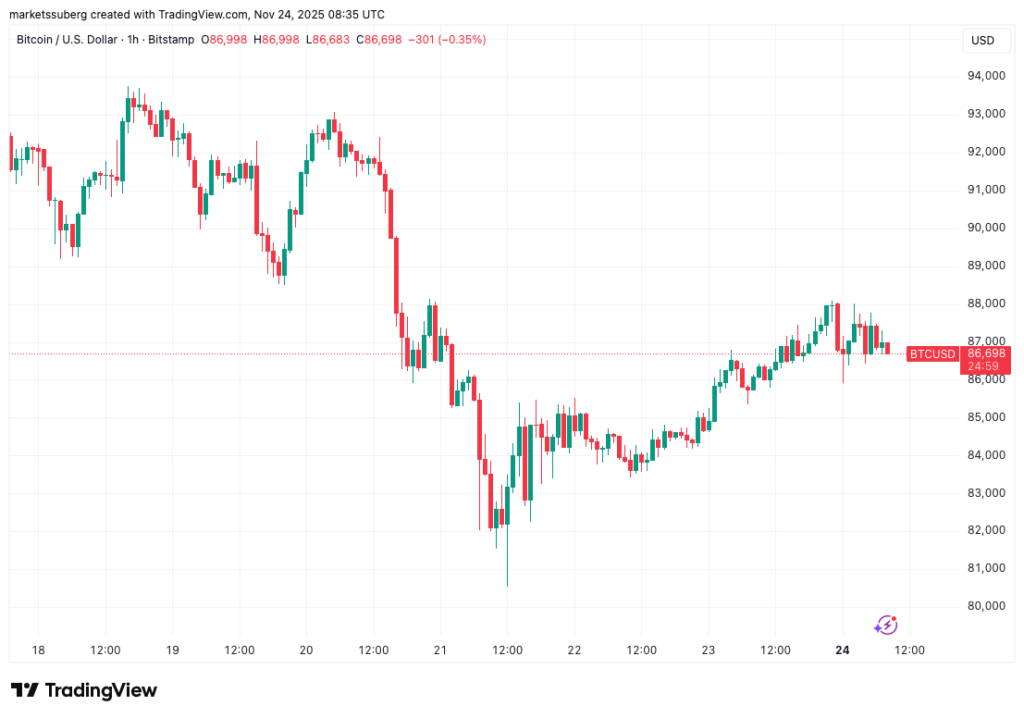
“Bitcoin has reclaimed the 4H SMA-20 for the first time in 2 weeks,” trader BitBull noted on social media, highlighting the 20-period simple moving average on the four-hour chart. Analysts such as Daan Crypto Trades and Michaël van de Poppe suggest that the weekly structure is still intact, hinting at a potential move toward $90,000–$96,000 if momentum continues.
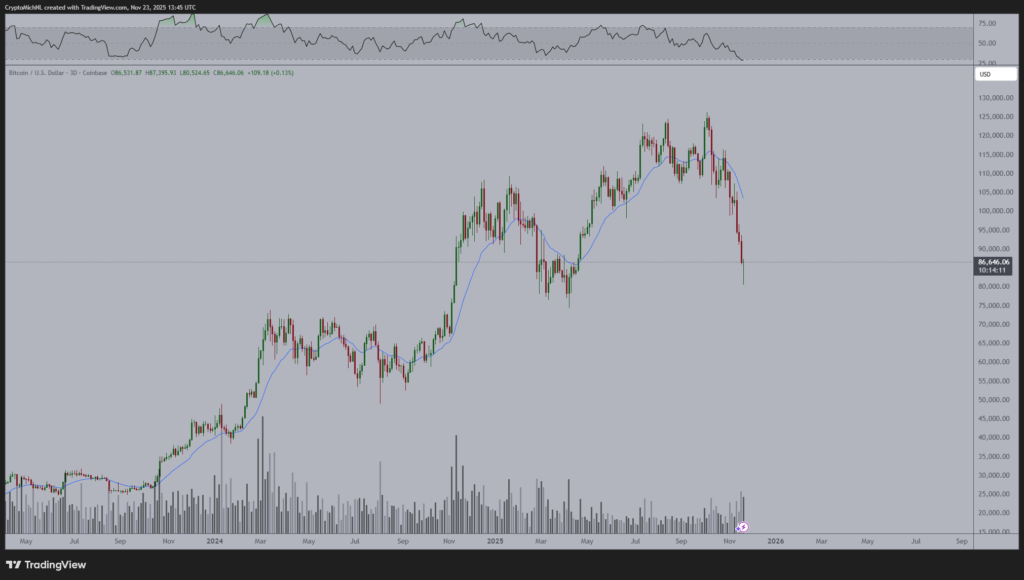
However, Bitcoin faces a technical dilemma: the “death cross” on daily timeframes. Formed when the 50-day simple moving average (SMA) crosses below the 200-day SMA on November 15, this classic bear signal emphasizes the need for a major recovery to prevent a prolonged downtrend.
Commentator Benjamin Cowen noted that previous death crosses often mark local market lows, but warned that failure to rebound could see BTC target the 200-day SMA at $110,130, potentially extinguishing hopes of a bull-market comeback.
Speculators Step In as Long-Term Holders Sell
On-chain data from CryptoQuant reveals a notable shift in Bitcoin ownership. Long-term holders (LTHs) are distributing coins, while short-term holders (STHs)—often driven by speculation—are actively buying and accumulating.
“This transfer has now reached approximately 63,000 BTC,” CryptoQuant contributor CryptoOnChain reported. The spent output profit ratio (SOPR), which measures profitability of coins moving on-chain, recently hit 15-month lows near 0.927, signaling that many new buyers are entering at relatively high prices.
Macro Data and Thanksgiving Week Influence
Despite the short Thanksgiving week in the U.S., traders are keeping a close eye on incoming economic data. Reports including Producer Price Index (PPI), Personal Consumption Expenditures (PCE), Q3 GDP, and initial jobless claims are poised to influence market sentiment.
Expectations for further interest-rate cuts by the Federal Reserve have waned, with CME Group’s FedWatch Tool showing around 70% odds for a 0.25% cut at December’s meeting. Fed minutes also signal that many officials favor maintaining the current target range for federal funds rates.
Crypto Leads the Sentiment Rebound
Interestingly, cryptocurrency sentiment appears to be outpacing traditional markets. After hitting 2025 lows, the Crypto Fear & Greed Index jumped to 19/100, compared to the S&P 500 equivalent at just 11/100. Social media analysis indicates significant panic selling and retail capitulation, marking the first such sentiment extremes in two years.
According to trading analyst Kobeissi, this downturn was largely structural, driven by leverage and liquidations, rather than any single news event. Leverage, in particular, has amplified shifts in investor sentiment, intensifying both selling pressure and potential recovery signals.





















[…] CME Group’s FedWatch tool currently shows an 84.7% probability of a December rate cut. Still, Fed Chair Jerome Powell recently stressed that another cut remains uncertain, adding a layer of macroeconomic ambiguity to the market landscape. […]