


Featured News Headlines
Bitcoin Network Activity Drops to Annual Lows, Sell Pressure Eases
Bitcoin (BTC) continues to trade near $87,000, but on-chain metrics and exchange liquidity data indicate that the market is in a low-participation phase, constraining any push above the $90,000 mark.
Network Activity Dips to Yearly Lows
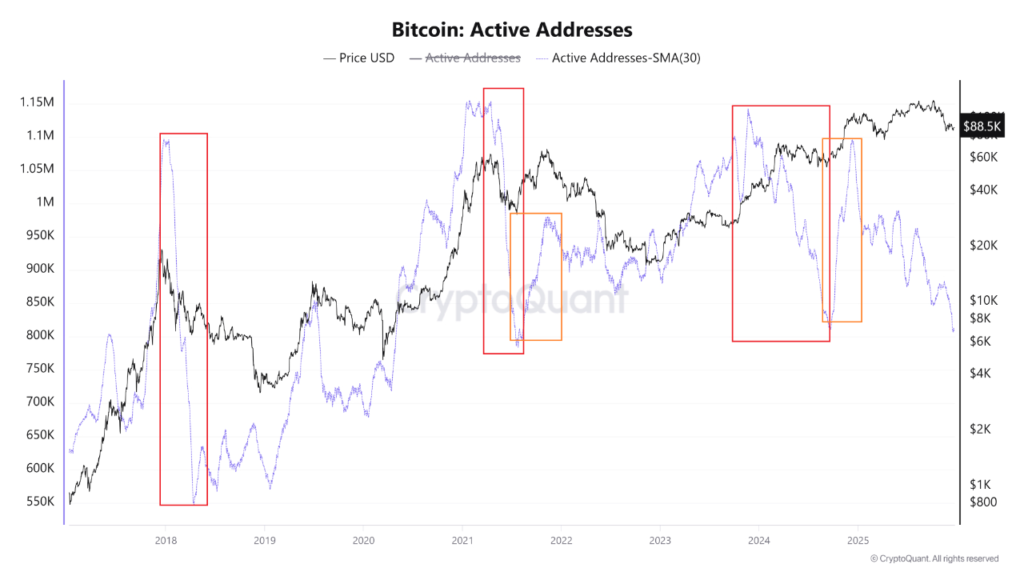
Data from CryptoQuant shows that Bitcoin’s network activity is slowing significantly. The 30-day moving average of active addresses has fallen to roughly 807,000, the lowest level in the past year. This signals declining engagement from retail users and short-term traders, contributing to a market stalemate.
Similarly, exchange inflows on Binance and Coinbase have contracted sharply. Depositing and withdrawing addresses are both at annual lows, reflecting a pause in aggressive accumulation and contained sell-side pressure. Long-term holders appear to be holding their positions rather than selling, keeping the market in a delicate balance.
Liquidity Tightens Amid Low Inflows
Exchange inflow data highlights a notable liquidity contraction. On November 24, when BTC traded near $88,500, seven-day cumulative inflows were $21 billion on Coinbase and $15.3 billion on Binance. By December 21, inflows had dropped to $7.8 billion on Coinbase (a 63% decline) and $10.3 billion on Binance, signaling reduced short-term trading activity and tighter market conditions.


Price Range and Liquidity Zones
Technically, Bitcoin remains range-bound between $85,000 and $90,000, struggling to sustain a breakout above resistance. The price currently sits below the monthly VWAP, reinforcing a neutral-to-cautious bias.
Liquidity clusters highlight key levels: on the downside, a buy-side fair-value gap (FVG) between $85,800 and $86,500 contains over $60 million in long positions at risk of liquidation. On the upside, a sell-side FVG between $90,600 and $92,000 holds around $70 million in short liquidation exposure. The next short-term move for BTC is likely to depend on which side of this range is tested first.


Comments are closed.