


Featured News Headlines
BTC Forms Bearish Pattern: Analysts Eye $98K as Next Support
Bitcoin [BTC] has entered a cautious phase, dropping nearly 14% since hitting its all-time high of $124,517 in early August. The asset has now logged four consecutive red weekly candles and is currently trading just above a key support level near $103,500.
The question on every trader’s mind: is the bottom in, or is more downside ahead?
A Bearish Pattern Takes Shape
Bitcoin’s current price structure is flashing red flags. The asset appears to be trading within an ascending wedge, a bearish chart pattern that often precedes downward breakouts. This structure was validated when BTC printed a shooting star candlestick near its record high—a classic signal of buyer exhaustion.
If the wedge breakdown scenario plays out, analysts suggest Bitcoin could fall as low as $98,000 before finding meaningful support.


However, there’s also a chance for a brief upward retest of resistance, which means a new all-time high isn’t entirely off the table—at least not before any deeper pullback unfolds.
Momentum Indicators Hint at Weakness
Technical indicators are leaning bearish as well.
- The Relative Strength Index (RSI) is hovering just above 50 and trending lower, indicating waning bullish momentum.
- Meanwhile, the Moving Average Convergence Divergence (MACD) has recently made a bearish crossover, a signal historically linked to upcoming declines.
These divergences between price action and momentum indicators started forming even before Bitcoin’s peak, suggesting that the current correction was already in motion beneath the surface.
Some traders remain hopeful that BTC could mirror its April price deviation, where the RSI dipped below 50 temporarily before the asset launched into a new rally. But without confirmation, the broader sentiment leans cautious.
What the Charts Are Saying
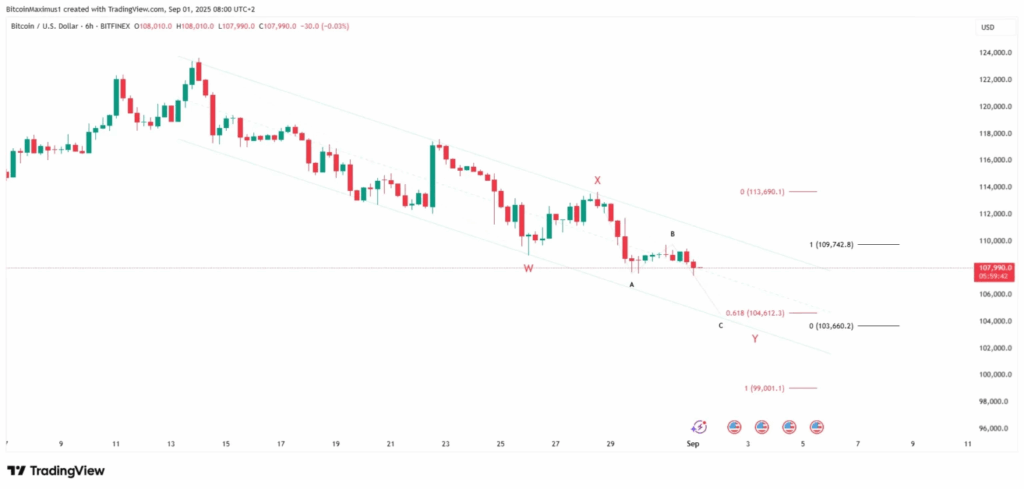
On the short-term 6-hour chart, Bitcoin is trading inside a descending parallel channel, a formation typically associated with corrective (not impulsive) moves.
This suggests that the current downturn might still be part of a larger bullish trend, though a drop to the channel’s lower boundary near $104,500 is possible before any bounce.
The RSI and MACD continue to trend downward on this timeframe as well. While there are early signs of a potential bullish divergence, especially on the MACD, this signal has yet to be confirmed with price movement.
In other words, buyers haven’t stepped in with conviction.
Elliott Wave Count Suggests a Final Leg Down
The Elliott Wave analysis also points to a possible bottom forming between $103,600 and $104,600.
According to the current count, Bitcoin is completing wave Y of a W-X-Y corrective structure. If wave Y reaches 61.8% the length of wave W, the projected bottom would land around $104,600.
An alternate sub-wave count gives a slightly lower target of $103,660, assuming wave C mirrors the length of wave A. Some bearish scenarios even point to $99,000, but that would require BTC to break below its current descending channel—which hasn’t happened yet.
For now, the confluence of both chart pattern support and wave-based projections points to the $104K zone as a key area to watch.
Bottoming Signs Are Emerging, But Caution Remains
The combination of short-term price action, trend channel behavior, and wave analysis suggests that Bitcoin may be nearing the end of its correction.
But it’s not a confirmed bottom—yet.
With sentiment still fragile and momentum indicators flashing warning signs, a strong reaction will be needed near $104,000 to validate a reversal. Until then, the risk of further downside remains intact.
As always, Bitcoin remains highly reactive to broader market conditions, macroeconomic events, and investor sentiment.


Comments are closed.