


Featured News Headlines
Ethereum Consolidates Above $4,750 in Rising Channel
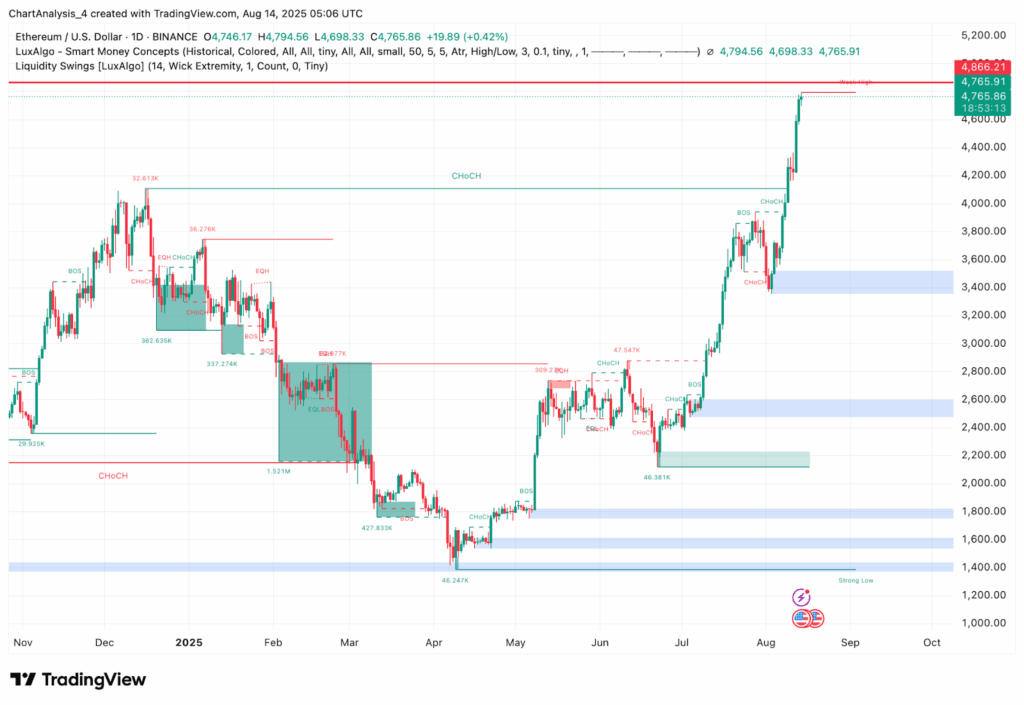
Ethereum has climbed steadily from below $3,800 earlier this month to settle above the $4,750 mark. Trading within a clearly defined upward channel, the price remains comfortably above both the VWAP and short-term EMA clusters throughout the day. This positioning indicates strong support for continued bullish movement.
Channel Structure and Key Price Levels
On the 30-minute chart, Ethereum is moving inside an ascending channel. The lower boundary around $4,723 is acting as a reliable dynamic support, while the upper boundary approaches the $4,870 zone—a key resistance level linked to past liquidity and previous price peaks.
VWAP readings—ranging between $4,746 and $4,770—sit in the heart of this channel, balancing buying and selling pressure. According to market analysis, when price stays above both VWAP and EMAs, it signals a sustained upward trend due to steady demand UEEx Technology.
Momentum Indicators Signal Room for More Growth
The Relative Strength Index (RSI) currently reads around 59.7, suggesting mild bullish sentiment without entering overbought territory. This aligns with a controlled momentum, implying that Ethereum still has potential for further upside before facing exhaustion.


Recent volume data hints at increasing activity as the price nears the upper channel line, which is typical behavior during the buildup to a breakout. Historically, similar setups—and steady momentum near the upper boundary—have preceded continued upward moves in Ethereum’s price.
Breakout Outlook and Resistance Test
If Ethereum manages to break decisively above the $4,870 resistance level, it could open the door for additional upward momentum. This resistance zone has acted as a significant barrier in the past, and overcoming it would likely attract more buyers looking to capitalize on the breakout. Such a move would strengthen the bullish trend and may lead to the establishment of new local highs, pushing Ethereum’s price even further upward. Traders and investors often view a confirmed breakout above key resistance levels as a strong signal of market confidence, which in turn can fuel further price appreciation.
On the other hand, if Ethereum fails to break through the $4,870 resistance convincingly, the price might retrace back toward critical support areas. One key level to watch is the VWAP (Volume Weighted Average Price), currently hovering between $4,746 and $4,770, which represents the average price weighted by volume and often acts as a dynamic support. Additionally, the lower boundary of the ascending channel, around $4,723, could also serve as a support zone where buyers might step in to defend the price. A pullback to these support levels wouldn’t necessarily invalidate the overall bullish outlook, as long as Ethereum holds above them.
Watch Momentum and Key Levels
Ethereum has built a technically strong base above $4,750, supported by ascending channel structure, balanced VWAP levels, and rising EMA clusters. The RSI remains comfortably under overbought levels, indicating sustainable upside.
Critical levels to watch:
- Support: $4,723 (lower channel boundary) and VWAP range ($4,746–$4,770)
- Resistance: $4,870 (upper channel boundary)
A breakout above $4,870 may open the way for further gains, while a drop below the VWAP or lower channel line could signal consolidation or correction. Traders should closely monitor volume and price behavior near these thresholds.


Comments are closed.