


BTC Price Action- Why Bitcoin’s Recent Bounce Could Trigger a Strong 3.3% Rally
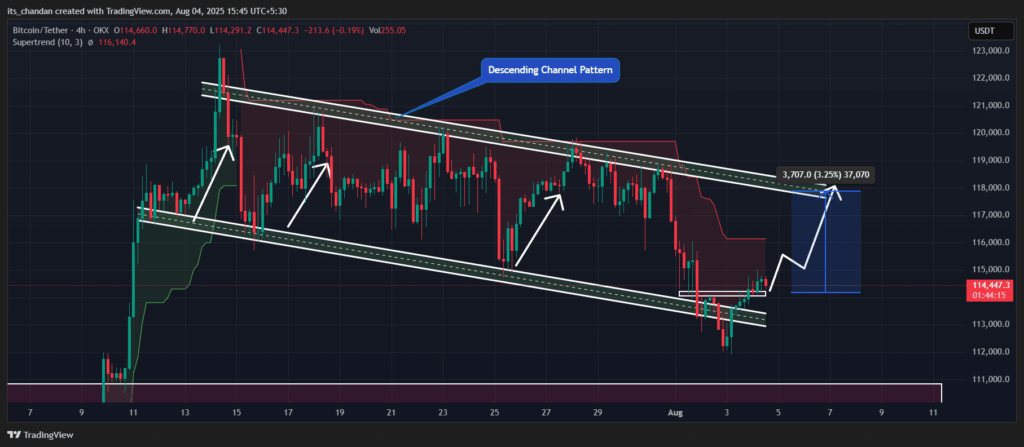
BTC Price Action– Bitcoin [BTC] is showing early signs of a potential comeback. On August 4th, BTC reclaimed the lower boundary of its Descending Channel—a technical development that has traders eyeing a possible short-term bounce.
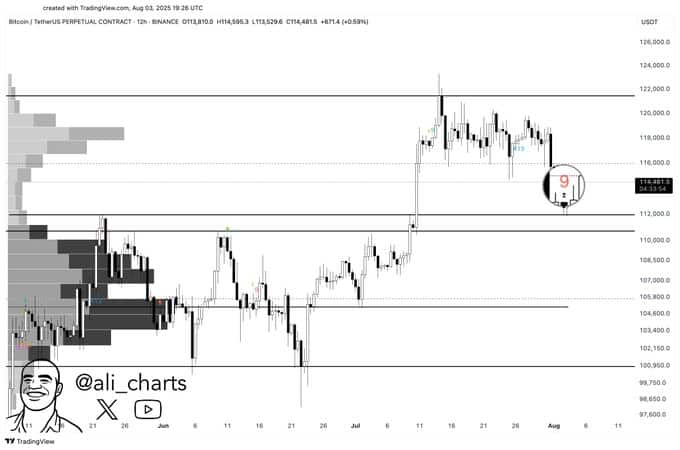
Adding fuel to the fire, the 12-hour chart flashed a TD Sequential ‘Buy’ signal, often seen as a precursor to trend reversals. While daily trading volume dropped by 14% to $49.18 billion, the underlying market structure is beginning to show promise.
Bullish Patterns Hint at Upside
Despite low volume, BTC’s price structure is turning constructive. A bullish inverted Head and Shoulders pattern has formed along the channel’s bottom, indicating growing dip-buying interest.
Currently trading around $114,700, Bitcoin is testing the $114,000 support zone. If buyers hold the line, analysts expect a 3.3% upside move to $118,000. TradingView charts confirm this outlook, showing a potential bounce play from the channel’s base.


However, mixed signals from the Supertrend Indicator suggest caution. While it’s bullish on the hourly chart, it remains bearish on the 4-hour timeframe—implying BTC may still be in a consolidation phase.
Analysts and On-Chain Data Confirm Accumulation
Crypto analyst Ali Martinez reinforced bullish sentiment by highlighting the TD Sequential signal, backed by a 9-count formation and bounce from $113,500. He suggests this could be the start of a trend reversal.
Supporting this view, CoinGlass data shows $18.84 million worth of BTC has flowed out of exchanges in the past 24 hours. This kind of movement typically signals strong accumulation from both retail and institutional investors.
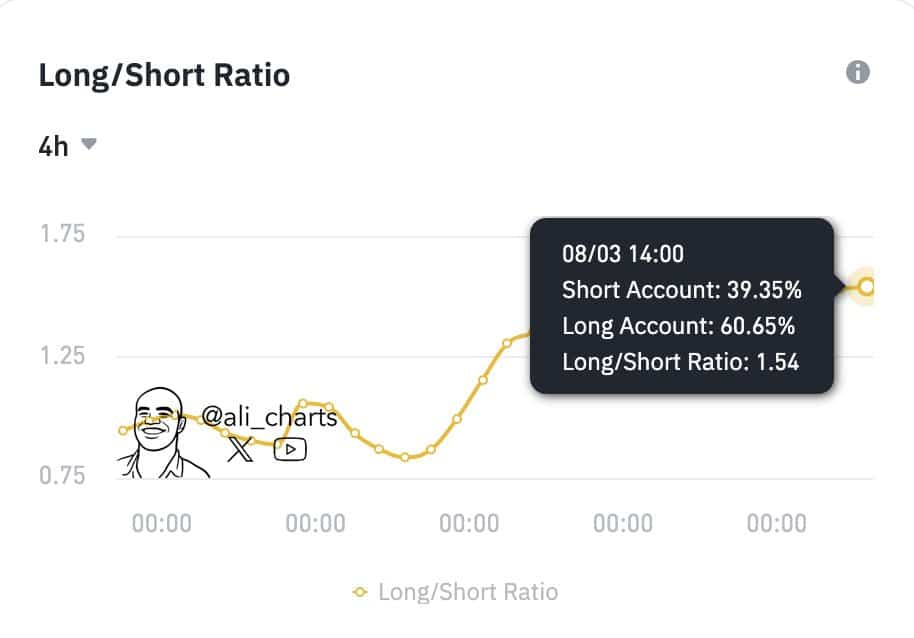
With 60.65% of open positions now long, the market seems to be quietly positioning for Bitcoin’s next big move.


Comments are closed.