

HBAR Price: Key Technical Signals Indicate Possible Steep Decline
HBAR Price– What looks like a simple cooldown for Hedera (HBAR) could be the start of a more significant correction. A detailed analysis of past price behavior, short-term chart signals, and critical support zones reveals traders may be preparing for further downside.
Historical Drawdown Zone Signals Profit Taking
HBAR recently entered a price zone known for heavy profit-taking. Back in March 2025, after HBAR surged to $0.26, it experienced a sharp 47% drop following a 53.74% drawdown from its all-time high. Fast forward to July 22, and the token again reached a 52% drawdown near $0.27, triggering a fresh correction phase.
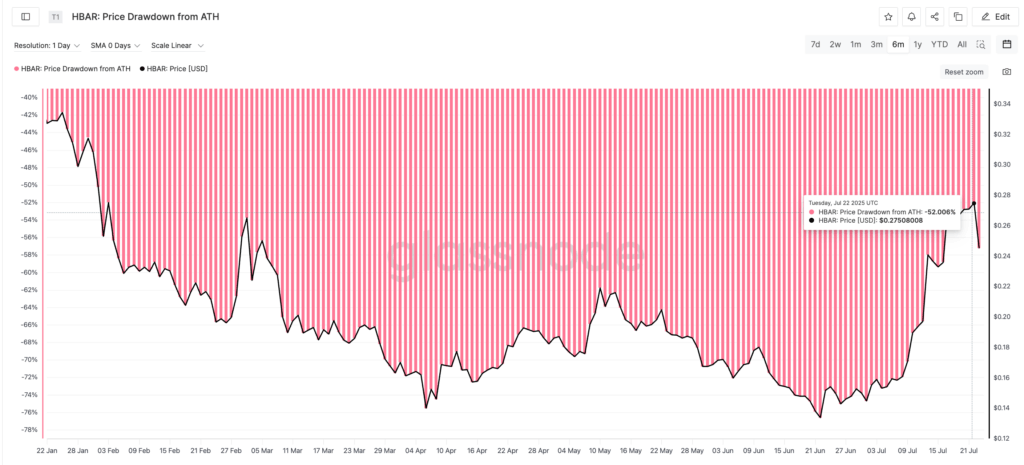
Even if this new correction mimics the March sell-off with less intensity, a 40% fall from $0.27 would push HBAR close to $0.16 — aligning with a major historical support level. This pattern suggests that traders are once again locking in profits around these familiar drawdown thresholds.
Death Cross Warning on the 4-Hour Chart
Zooming into the 4-hour timeframe reveals a looming bearish signal. The 20-period EMA (red line) is nearing a crossover below the 50-period EMA (orange line), a technical setup known as the “death cross.” Though not triggered yet, this crossover often signals accelerating downward momentum.


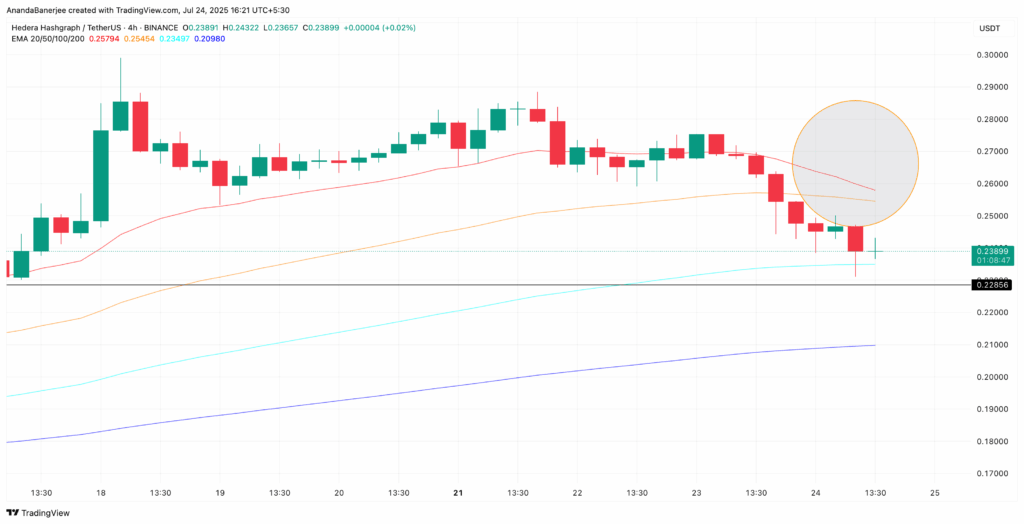
Supporting this bearish outlook, the Bull Bear Power Index recently flipped negative, indicating sellers are gaining strength. If the death cross confirms and sellers dominate, expect momentum-driven price declines to deepen HBAR’s drop.
Disclaimer: This article is for informational purposes only and does not constitute investment advice. Cryptocurrencies and stocks, particularly in micro-cap companies, are subject to significant volatility and risk. Please conduct thorough research before making any investment decisions.


Comments are closed.