


Featured News Headlines
Ethereum Liquidity and Downside Levels Explained
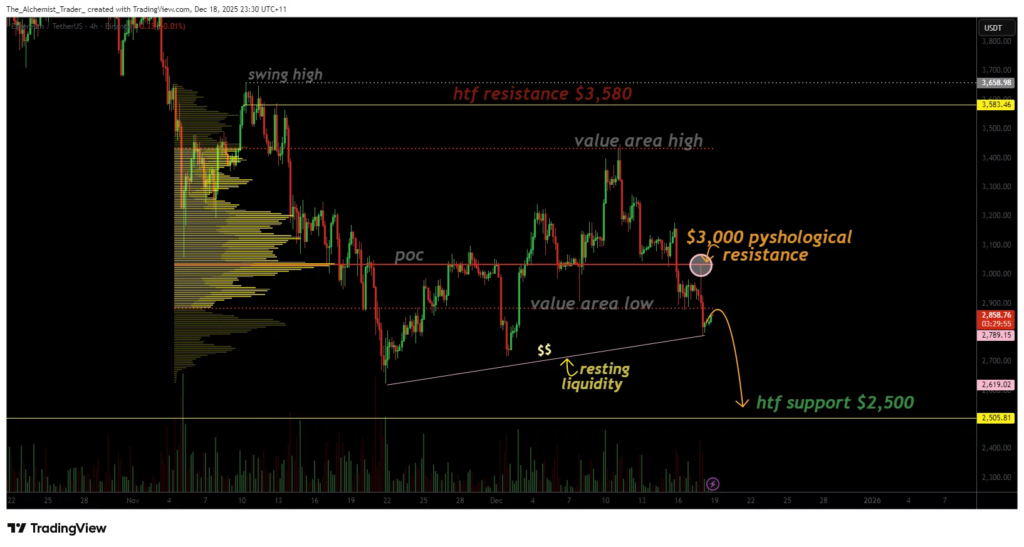
Ethereum (ETH) is currently experiencing heightened selling pressure after breaking below the critical $3,000 psychological support level, which coincided with the market’s Point of Control (POC). This breakdown represents a significant shift in market structure, turning $3,000 from a support area into a potential resistance zone. According to market observers, the inability of Ethereum to reclaim this level on a closing basis reinforces the dominance of bearish momentum, suggesting the likelihood of further corrective movements.
Structural Weakness Confirmed Below $3,000
The loss of $3,000 and the POC highlights Ethereum’s structural vulnerability. Historically, this price zone acted as a major equilibrium point, where high trading volumes accumulated, creating balance in the market. Its breakdown signals a departure from this equilibrium, paving the way for renewed downside exploration. Analysts note that attempts to rally above this level have consistently failed, confirming $3,000 as a formidable resistance point.
Market structure remains distinctly bearish, characterized by consecutive lower highs and lower lows. In such an environment, small relief rallies should be interpreted as temporary corrections rather than the start of a recovery. “Since breaking below the Point of Control, Ethereum has attempted minor relief rallies. However, these moves have been rejected almost ‘to the dollar,’ reinforcing $3,000 as a firm resistance zone,” market commentary highlights.
Liquidity and Capitulation Risks
A key factor adding to downside risk is the accumulation of resting liquidity below Ethereum’s current price. Since reaching a local low near $2,600, liquidity has steadily built beneath that level. Historically, markets often move to capture these liquidity pools, particularly when bearish momentum persists and structural support fails.


The next significant downside target is around $2,500, a region aligned with previous consolidation and structural demand. Entering this zone could trigger accelerated selling, forced liquidations, and broader market reactions, which are typical characteristics of a capitulation phase. Such events often represent the final stages of a corrective cycle before potential stabilization.
“Markets tend to seek out these liquidity pools, especially when bearish momentum remains intact and structural support levels fail,” industry analysts note. Price action suggests that Ethereum’s current behavior below $3,000 reflects market acceptance rather than rejection. Consolidation beneath a broken key level generally increases the probability of further downward movement.
Price Behavior and Market Dynamics
Ethereum’s ongoing inability to reclaim $3,000 on a meaningful basis signals a continuation of bearish sentiment. Short-term rallies within this context are likely to form lower highs, reinforcing the prevailing downtrend rather than reversing it.
Volume trends support this bearish outlook. Recent downward moves have exhibited higher participation compared to upside attempts, indicating that sellers continue to dominate market activity. Until Ethereum demonstrates sustained buying pressure above $3,000, bullish scenarios remain secondary.
“From a price-action perspective, Ethereum’s behavior below $3,000 reflects acceptance rather than rejection. Price is consolidating below the resistance level instead of reclaiming it, which statistically favors a continuation of the decline,” reports note.
Watching Key Levels for Potential Market Signals
While the immediate outlook leans bearish, market participants are advised to monitor Ethereum’s reaction around $2,500 closely. This area represents the next high-time-frame support zone and contains significant liquidity. A strong response in this region could indicate exhaustion of selling pressure, potentially setting the stage for a stabilization phase.
Despite the prevailing negative sentiment, analysts caution that consolidation patterns below broken levels often precede decisive moves, either downward or toward eventual equilibrium. Observing these zones can provide insight into market behavior and the balance between buyers and sellers.
Ethereum’s break below the $3,000 psychological level and Point of Control has marked a shift toward bearish dominance in its market structure. Consecutive lower highs and lower lows, failed relief rallies, and persistent selling pressure all point to an elevated risk of continued downside activity.
Key liquidity zones near $2,500 are likely to play a central role in the next phase of price action, potentially triggering capitulation-style behavior. Until these levels are tested, and unless Ethereum can reclaim $3,000 with sustained volume, the prevailing trend remains structurally bearish.
“Continued consolidation beneath this region increases the likelihood of a capitulation move toward $2,500, where the next major support and liquidity zone is located,” commentary highlights. Traders and observers are therefore closely watching these levels for indications of potential market stabilization, even as short-term sentiment remains negative.


Comments are closed.