


Featured News Headlines
ETH Price Recovery Driven by Fusaka Upgrade and ETF Inflows
Ethereum (ETH) has recovered above the critical $3,000 level following a two-week decline, drawing investor attention. According to CoinGecko, Ethereum fell from $3,633 on November 10 to a monthly low of $2,680 on November 21. Since then, ETH has rebounded to around $3,013, recording a 7.3% gain over the past seven days, yet still remains nearly 40% below its all-time high of $4,980 reached in August.
Declining Exchange Reserves Support Price
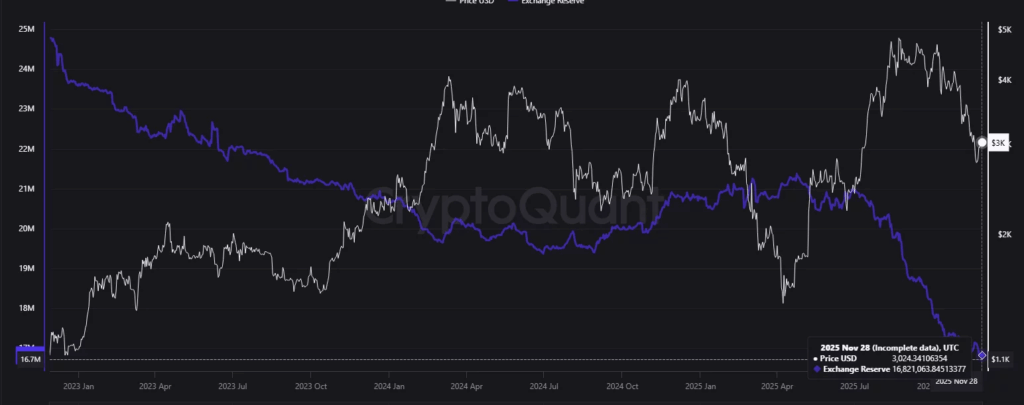
The first key factor behind Ethereum’s recent price movement is the declining supply of tokens held on exchanges. CryptoQuant data shows that exchange reserves dropped from 20.9 million ETH in early July to 16.8 million ETH at the time of reporting.
Analysts note that lower exchange supply reduces immediate selling pressure, as fewer tokens are available for quick sale, supporting upward momentum in prices.
Fusaka Upgrade Sparks Community Interest
The second catalyst is the anticipated Fusaka upgrade. Scheduled for December 3, this update represents the largest network enhancement since “The Merge” and aims to improve data availability for rollups, addressing one of Ethereum’s key bottlenecks. The expected improvements have generated strong community and investor interest, positively impacting price sentiment.


Spot ETH ETF Inflows
A third factor supporting Ethereum’s recovery is renewed inflows into U.S. spot ETH ETFs. Data from SoSoValue shows that nine spot ETH ETFs recorded $236 million in net inflows this week after three consecutive weeks of outflows totaling $1.7 billion. These inflows contributed to short-term bullish momentum in the market.
Institutional Accumulation and Market Confidence
Institutional investors have also played a key role in boosting confidence. Accumulation by large players such as Bitmine helps reinforce long-term confidence in Ethereum, even amid short-term volatility. Analysts highlight that institutional demand strengthens the overall market sentiment and provides stability.
Technical Analysis and Key Price Levels
On the daily chart, Ethereum has broken out of a falling wedge pattern, a formation characterized by consecutive lower lows and lower highs within two converging descending trendlines. Analysts note that breaking such a structure is often a precursor to a shift from bearish to bullish trend.
Currently, the 200-day moving average at $3,096 represents the next key resistance. A sustained move above this level could trigger a rally toward $3,600, aligning with the 61.8% Fibonacci retracement level from the recent swing high to low.
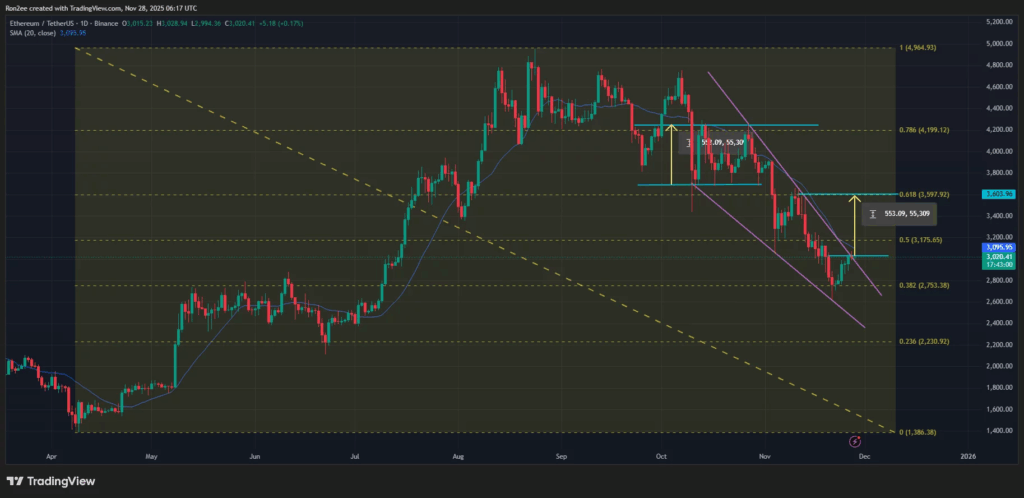
Conversely, if Ethereum fails to maintain the $3,000 support, the next critical support level lies around $2,750, which corresponds to the 38.2% Fibonacci retracement level and represents a potential short-term risk zone.
In conclusion, Ethereum has recovered above $3,000 following a short-term dip. Declining exchange reserves, the Fusaka upgrade, and inflows into spot ETH ETFs have contributed to positive market sentiment. Institutional accumulation and technical breakout patterns further indicate a potential trend shift.
However, the $3,000 support level remains critical. Failure to hold this level could result in a retracement toward $2,750. Analysts recommend monitoring key technical levels and liquidity zones closely. Ethereum’s performance continues to attract attention for both short-term price movements and long-term network developments.


Comments are closed.