


Featured News Headlines
BTC Shows Undervaluation Amid Key On-Chain Metrics
Recent data suggest that Bitcoin may be approaching a period of undervaluation, according to key on-chain metrics and market indicators.
Puell Multiple Points to Discount Zone
CryptoQuant data shows that the Puell Multiple, which tracks miners’ daily revenue against the annual average, has returned to the discount zone following Bitcoin’s recent drop to around $80,500.
“At 0.86, the metric signals undervaluation and suggests that the market is pricing Bitcoin below its fair value,” CryptoQuant analyst Gaah said in a QuickTake analysis.
Historically, when the Puell Multiple falls below 1, it indicates that miners are generating less revenue than usual, which may coincide with periods of financial stress and market capitulation. In April 2025, when the indicator was last at similar levels, BTC traded near $75,000 before rallying 50% to a previous high of $112,000 on May 22.


“Historically, all major correction reversals have started in precisely these discount regions,” Gaah added.
MVRV Z-Score Suggests Local Bottom
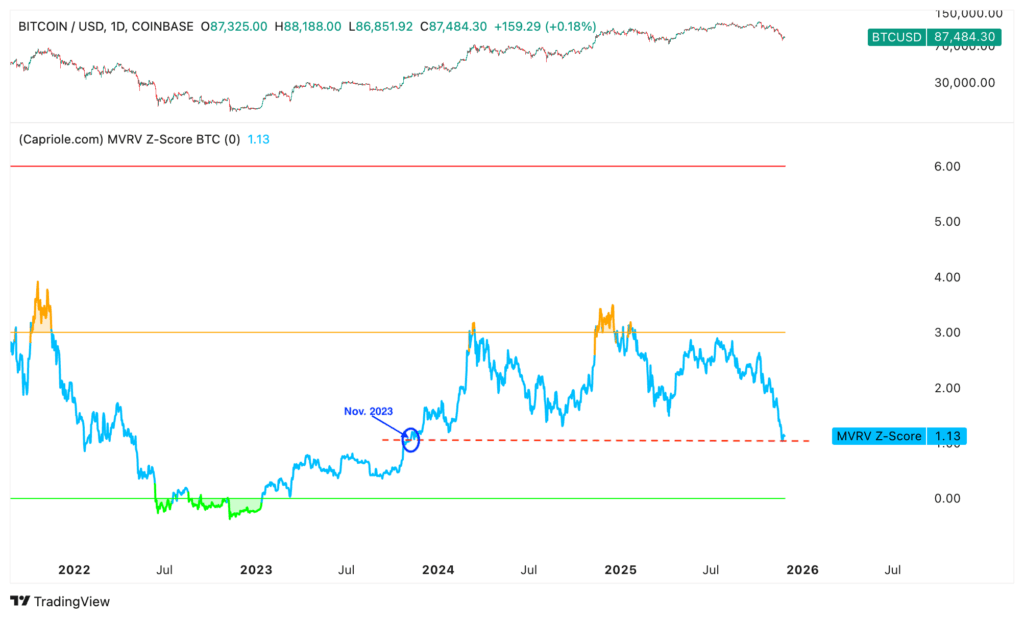
Capriole Investments data shows that Bitcoin’s MVRV Z-Score—which compares market value to realized value while adjusting for volatility—dropped to a two-year low on Nov. 22.
“All previous Bitcoin drawdowns have been accompanied by a notable drop in the MVRV Z-score and have ended with the metric crossing below the green line, signaling significant undervaluation,” the report noted.
At 1.13, the MVRV Z-Score is nearing the green line, suggesting that BTC/USD may be forming a local bottom. Similar levels at the end of 2023 preceded an 80% price rally in the fourth quarter of that year.
Bull Flag Pattern Signals Short-Term Rebound
Data from Cointelegraph Markets Pro and TradingView show that Bitcoin has risen 8.6% from its recent lows of $80,500. A bull flag pattern emerged when the price broke above the upper trendline at $87,200, with the market now retesting this level to confirm the breakout.
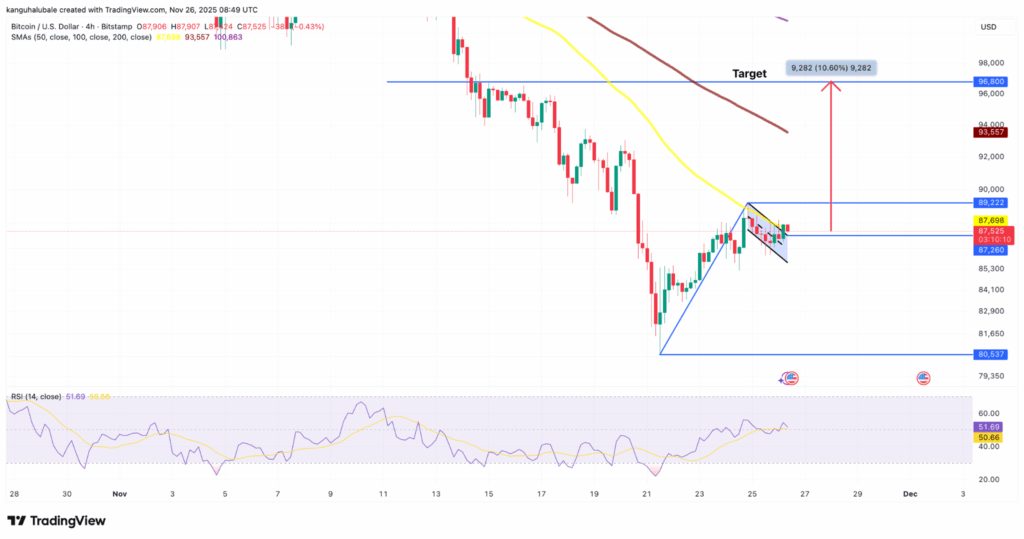
“A successful confirmation would clear the way for a rally toward the measured target of the flag at $96,800,” analysts note.
The positive relative strength index (RSI), rising to 51 from oversold levels on Saturday, suggests upward momentum building.
Potential Risks Remain
Despite these signals, veteran trader Peter Brandt cautioned that Bitcoin’s rebound toward $89,000 could be a temporary “dead cat bounce,” with the possibility of further downward movement.
“A final leverage flush below $80,000 is still possible, as the recent liquidation event may not yet be over,” the report highlighted.


Comments are closed.