


Featured News Headlines
ETH Price at Risk: Can the $3,000 Level Hold?
Ethereum has slipped below the $3,200 level following weeks of downward pressure, failing to maintain the 100-day moving average. After losing the key $3,800 resistance, the price is now struggling to hold the $3,000 support zone. While on-chain data shows a structurally bullish signal, technical indicators point to sellers taking control of the market.
Daily Chart: The $3,000 Line in Defense
Ethereum is attempting to hold the critical support zone around $3,000 on the daily timeframe. After dropping below $3,800, ETH also lost the 100-day moving average, which now sits around $3,400 and has flipped into a resistance level.
The 200-day moving average is also gradually sloping downward, a clear indication that medium-term trend strength is weakening. The RSI has declined to around 33, approaching oversold territory. While the indicator confirms bearish momentum, it may also be setting the stage for a technical bounce.
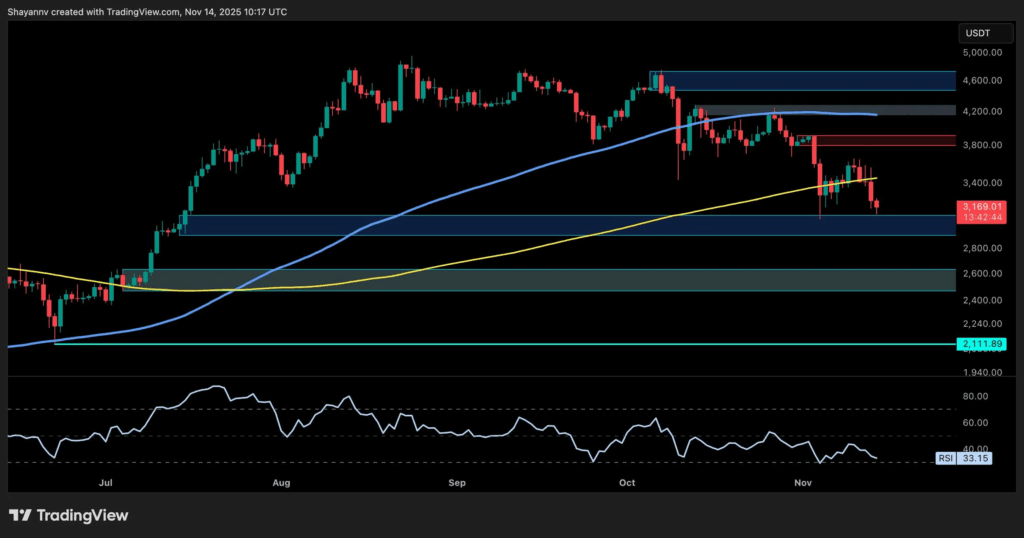
If the $3,000 support breaks, the next major support level sits at $2,500. This zone aligns with a previous demand area from early Q3 2024. For buyers to regain control, they need to reclaim $3,800 with strong volume and flip both moving averages back to support.


4-Hour Chart Shows Bearish Flag Breakdown
On the four-hour timeframe, Ethereum confirmed the bearish flag breakdown, signaling continuation to the downside. After failing to reclaim the $3,600 resistance area, the price faced aggressive selling pressure. It’s now testing the $3,000 demand zone.
The structure has been clearly bearish since early October, forming consecutive lower highs and lower lows. Momentum indicators remain weak as well. The RSI hovers around 33 on this timeframe too, leaving room for potential further downside.
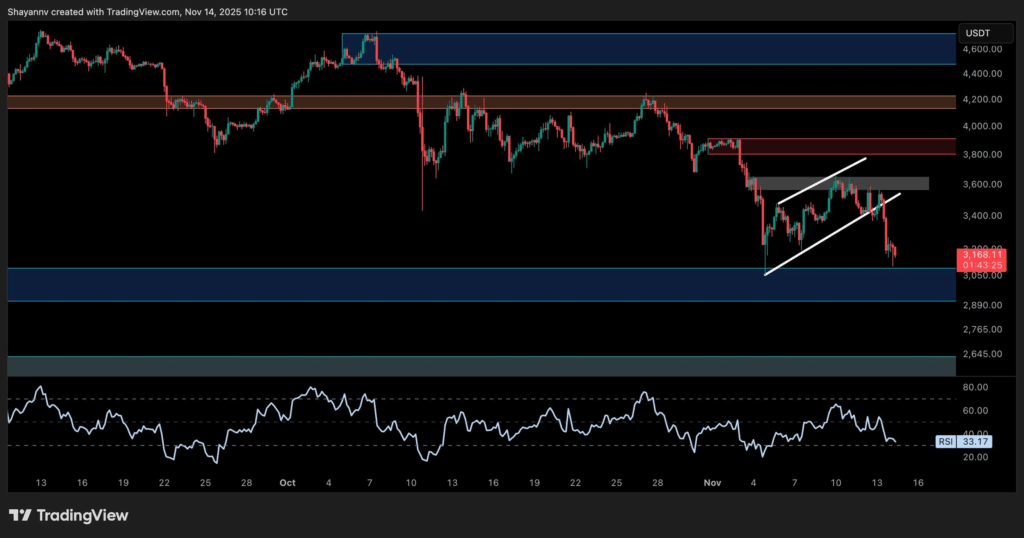
If the $3,000 support breaks, $2,600 emerges as the next key level to watch. Short-term bounces toward $3,300 or even $3,400 could occur, but these moves may simply offer selling opportunities unless accompanied by a volume spike and a clean breakout above the $3,800 resistance zone.
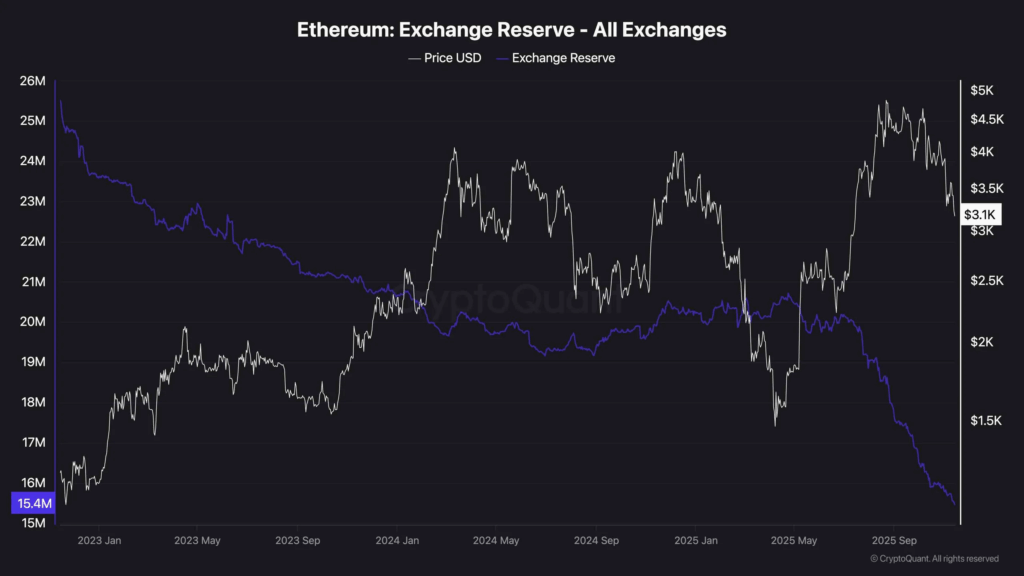
Exchange Reserves Hit Multi-Year Lows
Ethereum’s reserves on centralized exchanges continue their decline and are now at multi-year lows. With just over 15 million ETH sitting on exchanges, this represents a structurally bullish signal for the long term. The trend indicates investors are moving assets to self-custody and accumulating.
However, despite this positive supply dynamic, recent price action reveals that demand isn’t strong enough to absorb current spot selling. In other words, supply is low, but buyers aren’t stepping in aggressively. This allows corrections like the current one to develop.
Supply-Demand Imbalance Keeps Price Under Pressure
While on-chain data points to a long-term accumulation process, short-term price action reflects a demand deficit. Declining exchange reserves typically indicate reduced supply and lighter selling pressure. Yet for Ethereum, this hasn’t translated into price strength.
Market makers and major buyers haven’t entered aggressively. Spot buying pressure remains insufficient to overcome current selling walls. Demand needs to pick up meaningfully before the price can regain upward momentum.
Ethereum faces a disconnect between technical and on-chain indicators. While long-term supply dynamics look favorable, short-term momentum clearly favors sellers. The $3,000 support level will be the most critical test in the coming days.
If this level holds, a technical bounce could materialize, but talking about a trend reversal would be premature without a strong volume-backed breakout above $3,800. Market participants should account for the possibility of continued downside pressure until demand shows a significant pickup.


Comments are closed.