


ETH Loses Momentum: Technical Indicators Flash Bearish Warning
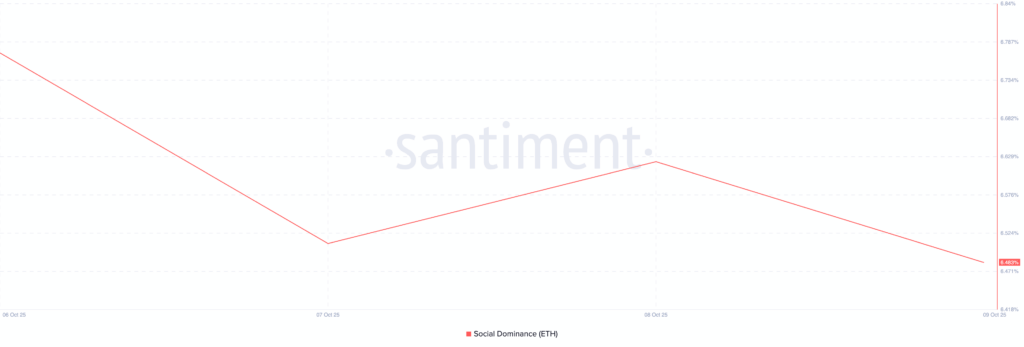
Ethereum’s recent price decline has done more than just trim market value — it’s also triggered a noticeable drop in investor sentiment. Social dominance for ETH — a metric that reflects how much Ethereum is mentioned in crypto-related conversations relative to other top 100 assets — has fallen to around 6.48%, down 5% over the past five days, according to Santiment data. The shift suggests that traders are looking elsewhere, as Ethereum loses momentum and visibility.
Across the broader crypto landscape, Bitcoin’s dominance has climbed slightly, now sitting in the low-60% range, highlighting BTC’s relative strength during this pullback. The total cryptocurrency market capitalization has dipped by roughly 3–5% this week, as a wave of volatility shook out highly leveraged positions. Over $1.7 billion in crypto liquidations occurred in the past 24 hours alone, with Ethereum long positions accounting for nearly $500 million — a clear indication of waning bullish conviction in the short term.
Theme: Ethereum capital rotation & outflows
Ethereum appears to be facing both speculative and structural pressure. Not only are leveraged traders exiting, but on-chain data reflects a deeper shift in market behavior:
- Exchange outflows for ETH have ticked higher, possibly suggesting that some investors are moving assets to cold wallets amid uncertainty — or preparing to rotate capital into other ecosystems.
- The number of active Ethereum addresses has remained stagnant or slightly declined, signaling weakening user activity and transactional demand.
- Major DeFi protocols on Ethereum are also seeing plateauing or declining TVL (Total Value Locked), as rival chains offering lower fees and faster transactions pull liquidity away.
“Smart money appears to be rotating out of Ethereum into either Bitcoin or selective high-conviction alts,” says Dana Chen, CEO of ChainPulse Analytics. “As ETH loses share in both on-chain metrics and social buzz, downside risks are becoming more pronounced unless demand reverts.”


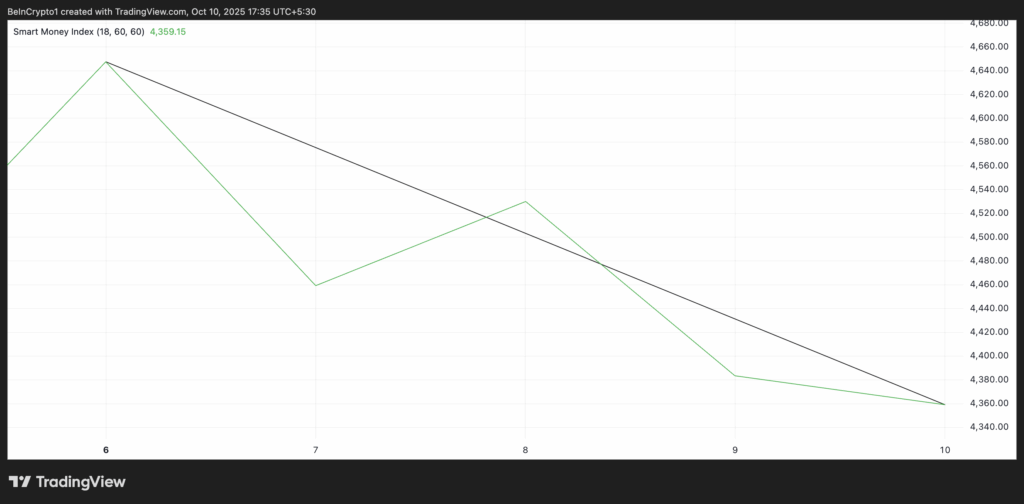
The decline in Ethereum’s Smart Money Index (SMI) also supports this view. The SMI, which tracks the behavior of sophisticated or institutional investors based on intraday activity, has fallen about 6% since Monday, currently sitting near 4,359. This suggests that informed players may be taking profits or bracing for a potential short-term correction.
Technical outlook: momentum frays
Ethereum’s technical indicators underscore the fading strength:
- Relative Strength Index (RSI) is hovering between 45 and 50 on the daily chart — a neutral zone, but notably weaker compared to earlier bullish momentum that had pushed RSI above 60.
- MACD has turned bearish on the 4-hour chart, with a crossover below the signal line and declining histogram bars — an early signal that selling pressure could persist.
- Directional Movement Index (DMI) shows −DI overtaking +DI, with ADX starting to rise from 18 toward 22, suggesting a potentially developing downward trend.
Price action is now testing the $4,211 support zone. A decisive breakdown below this level could expose ETH to deeper pullbacks, with potential targets near $4,000 or even $3,875. On the flip side, bulls would need to reclaim the $4,500–$4,600 range to regain control and build upward momentum.

Ethereum’s current trajectory remains fragile. With smart money reducing exposure, social sentiment waning, and on-chain activity showing signs of fatigue, the short-term outlook leans bearish to neutral. The market may consolidate in a broad range between $3,800 and $4,500 unless new catalysts — such as institutional inflows, protocol upgrades, or macroeconomic shifts — reignite demand.
Until then, traders may prefer to stay cautious, with attention turning toward assets showing stronger technical or on-chain strength. As capital rotates and narratives shift, Ethereum will need to prove renewed relevance to regain its footing.


Comments are closed.