


New Long-Term Bitcoin Target: Clues That a Pullback Is Brewing
Following a modest weekly increase of 1%, Bitcoin (BTC) has primarily been sideways this week, trading close to $121,300. The Bitcoin price movement appears to be uneventful at first glance. But a closer examination of important chart patterns and investor behavior indicates that it may take another pullback before the next significant breakout occurs. There are now some important clues pointing to a deeper pullback developing beneath the surface, both on the chart and on the chain. A new long-term goal is also starting to take shape at the same time.
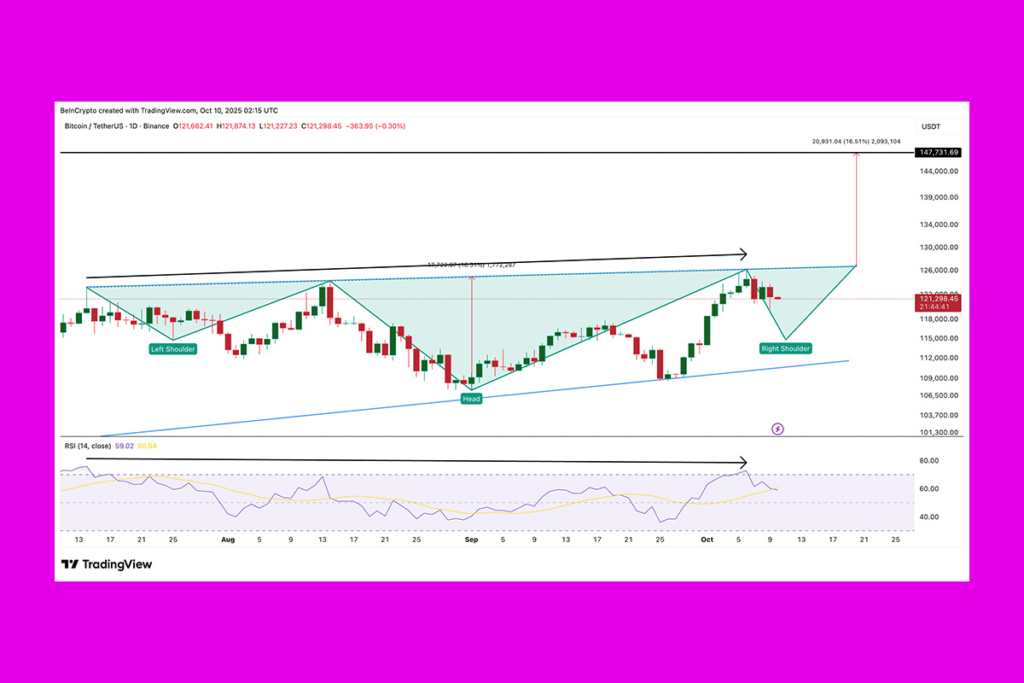
Bitcoin Chart Signals a Potential Major Reversal: Is a Surge or Drop Next?
The current configuration of Bitcoin is beginning to resemble a traditional reversal pattern that has been seen before significant rallies in the past. The left and right halves of the inverted head and shoulders pattern, which is still in its early stages of development, exhibit the first indications of symmetry. This implies that the market might be laying the groundwork for the upcoming surge. Short-term investors, meanwhile, are keeping an eye on a formation with a slightly rising slope that resembles a rising wedge. This structure suggests a more immediate downhill trend and possible fatigue close to the top.
The market momentum indicator, the Relative Strength Index (RSI), has begun to deviate from price at the same time. The price of Bitcoin reached greater highs between July and early October, but the RSI reached lower highs over that same period. This negative divergence frequently indicates waning purchasing power. This combination displays a bearish wedge-like structure, waning momentum, and a maturing chart pattern. It implies that before trying a breakout, the price of Bitcoin may first test lower levels to completely create its right side.
Bitcoin’s Inverse Head and Shoulders Pattern Could Trigger a Massive Rally
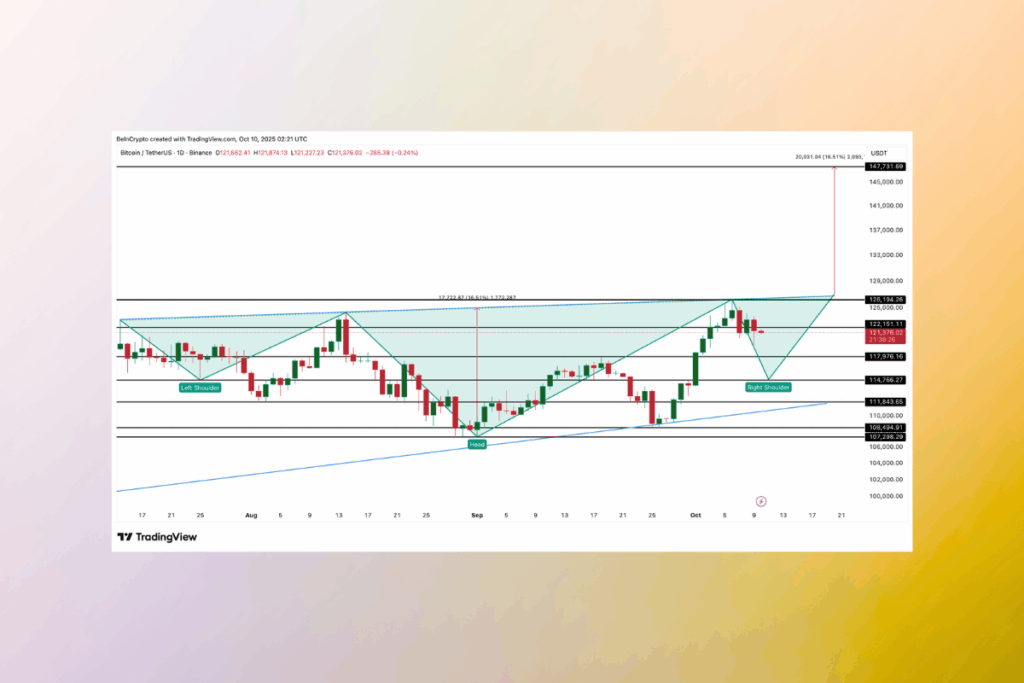
Based on its current arrangement, Bitcoin’s broader structure continues to aim for about $147,700. It is necessary for the market to stabilize before that move can occur. In order to break over the all-time high of $126,100, which is at the neckline level of the continuing inverse head and shoulders pattern, it must do so cleanly. Until then, $117,900, $114,700, and $111,800 represent short-term support. Maintaining those zones preserves the structure. Recovering $126,100 might lead to a surge above $147,700, while a decline below $107,200 would render the bullish forecast incorrect. The next step higher for Bitcoin begins now. To sum up, a pullback may occur prior to the push.


For more up-to-date crypto news, you can follow Crypto Data Space.


Comments are closed.