


Bitcoin’s October Surge: Is the Next Bull Run Already Underway?
October has seen Bitcoin begin to rise steadily. Even after a slight decline from its most recent all-time high, it is still trading above $124,000 and up about 8.09% week over week. There is more to the Bitcoin price movement than just momentum. Deep shifts in on-chain activity that show the confidence of both short-term and long-term holders further support it. One figure jumps out: $130,000, the next significant goal that the data and pattern both suggest.
Bitcoin Accumulation Hits 3-Year Low in Exchange Net Flow
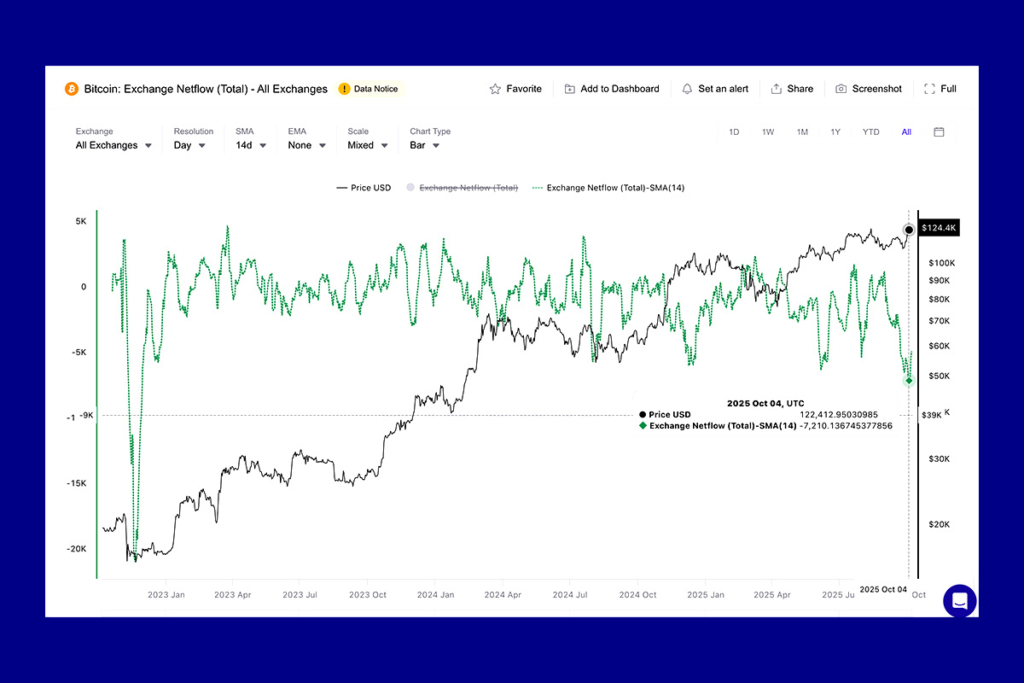
Bitcoin’s exchange net flow, which calculates the difference between coins coming into and going out of controlled exchanges, is one of the most obvious indicators of confidence. A negative figure indicates that more Bitcoin is being taken out than put in. This is usually a sign that owners would rather keep than sell. The 14-day Simple Moving Average (SMA) of Bitcoin’s net flow as of October 4 is at –7,210 BTC, the lowest level in almost three years. In November 2022, just before Bitcoin started its incredible ascent from $16,000 to over $72,000 in the ensuing months, net flows last fell this low.
The current reading is made even more interesting by that background. It shows that the market is subtly moving more in the direction of accumulation than distribution. To verify this, HODL Waves, which show the period during which coins remain inactive, are examined. Both long-term and short-term holders have increased their holdings throughout the last month. 2–3 year holdings increased slightly from 7.00% to 7.13% of supply, while the 1–3 month cohort increased from 8.75% to 9.59%. The 0.13% increase may seem insignificant, yet it amounts to tens of thousands of Bitcoin. When compared to the overall amount of Bitcoin, this is a significant change and a definite indication of long-term investors’ renewed faith.
Wyckoff Volume Shows Buyer Strength: BTC Poised for Major Surge
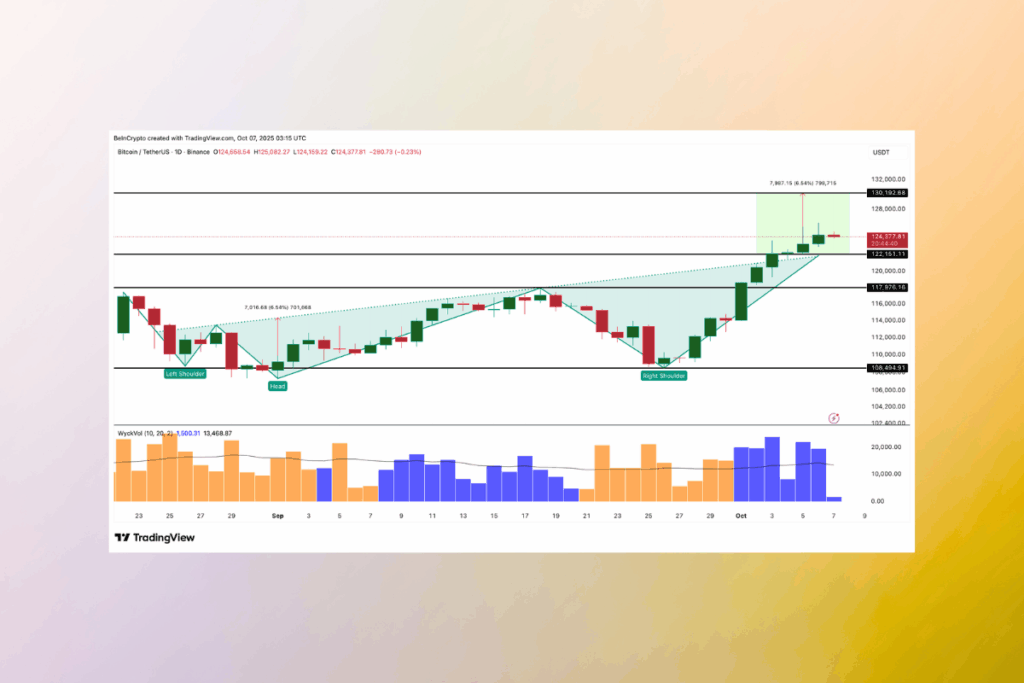
The price of Bitcoin closed solidly above the $122,100 neckline on the daily chart, confirming an inverse head-and-shoulders breakout. If momentum continues, the pattern predicts an immediate upward goal above $130,000.


Context is also added by the Wyckoff Volume indicator. This tool monitors whether trading sessions are dominated by buyers (blue bars) or sellers (orange bars). A change from blue to orange preceded a price decline from $117,900 to $108,400 during the most recent correction in September. This time, that change hasn’t occurred. The blue bars continue to rule, indicating that buyer desire is still strong. The climb to $130,100 appears very feasible if the price of Bitcoin is able to maintain its position above $122,100.
For more up-to-date crypto news, you can follow Crypto Data Space.


Comments are closed.