


PEPE Liquidations Spike: Can Bulls Hold the Line?
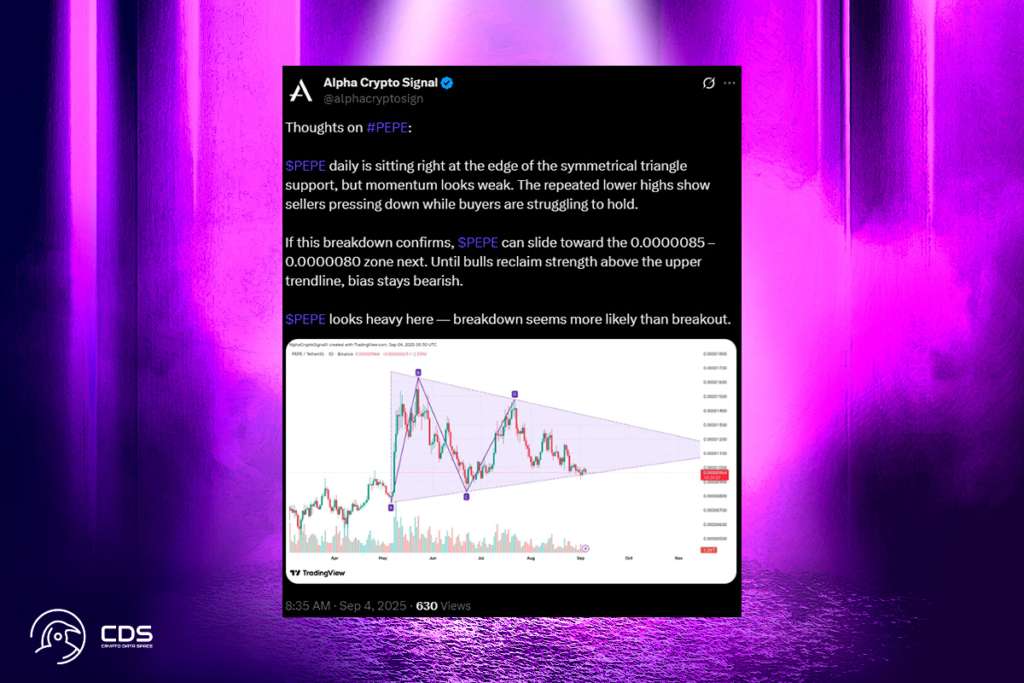
While testing triangle support, PEPE is trading at $0.000009613. Active addresses drastically decrease as long liquidations increase. The asset is located close to the lower edge of a symmetrical triangle on a daily chart. Although recent activity indicates increasing pressure from the upper side of the range, this area has served as support. The market has notably displayed a pattern of lower highs, indicating that selling pressure is still present. Although buyers have so far been able to maintain support, there is not much room in the current framework.
If this breakdown confirms, $PEPE can slide toward the 0.0000085 – 0.0000080 zone next.
Declining PEPE Volume Signals Possible Upcoming Volatility
Data indicates that trading volume has dropped by 15% to $980 million. Additionally, open interest has decreased by 4% to $535 million. These declines imply less active market positions, which is frequently an indication of decreased involvement prior to a more significant shift. Recent actions have primarily affected long positions on the liquidation side. Only $9,900 came from short liquidations, compared to almost $326K from long liquidations.


PEPE Triangular Pattern Suggests Potential $0.0000085 Slide
In the meantime, testing of the symmetrical triangular design is almost complete. If the price breaks through the support line around $0.0000095 and there is high volume, the next areas to watch will be around $0.0000085 and $0.0000080. In order to alter the existing configuration, a recovery exceeding $0.0000115 is required. Until then, the token’s cautious stance is maintained by trading volume, liquidation statistics, and on-chain usage.
For more up-to-date crypto news, you can follow Crypto Data Space.


Comments are closed.