

Pi Coin Shows Signs of Life: Is the Worst Over for PI?
For Pi Coin, July was difficult. Most traders have stopped paying attention. However, a change occurred during the first week of August. For the first time since July 30, two short-term bullish swings have emerged, suggesting a possible change in attitude, and PI recovered 4.6% from its all-time low.
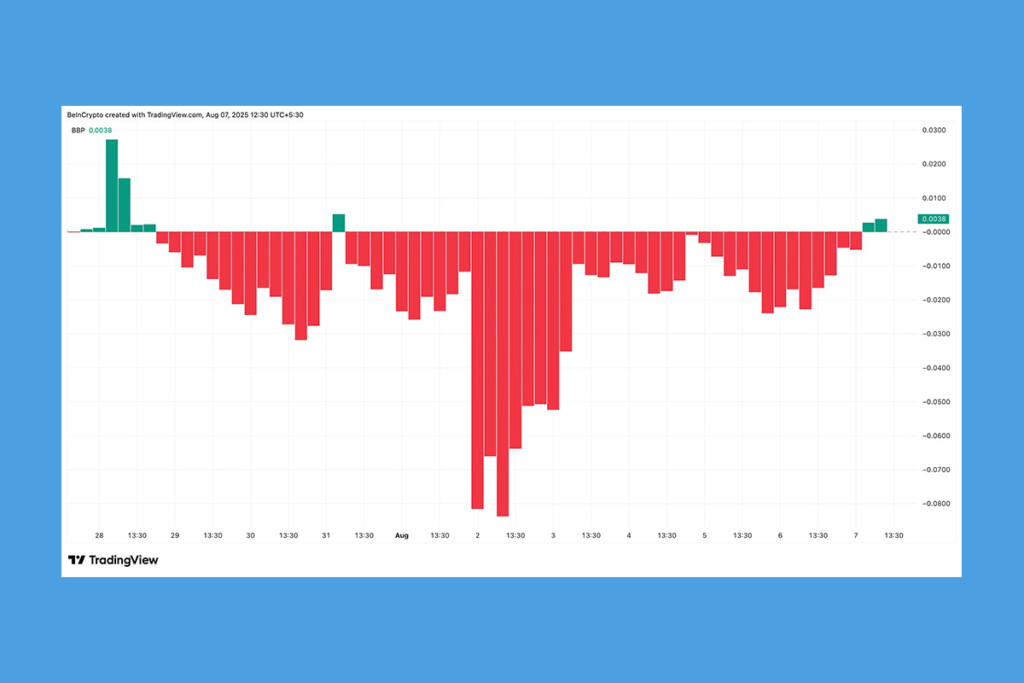
After more than 40 sessions, a green bar flashed on the 4-hour bull-bear power chart, marking the first noteworthy signal. This is important. Since the last time bulls appeared on this chart, which was in July, sellers have taken over. A green indicator indicates that, albeit momentarily, purchasing pressure has surpassed selling power for the first time in weeks.
Short-Term Momentum Builds as PI Coin Buyers Gain Strength
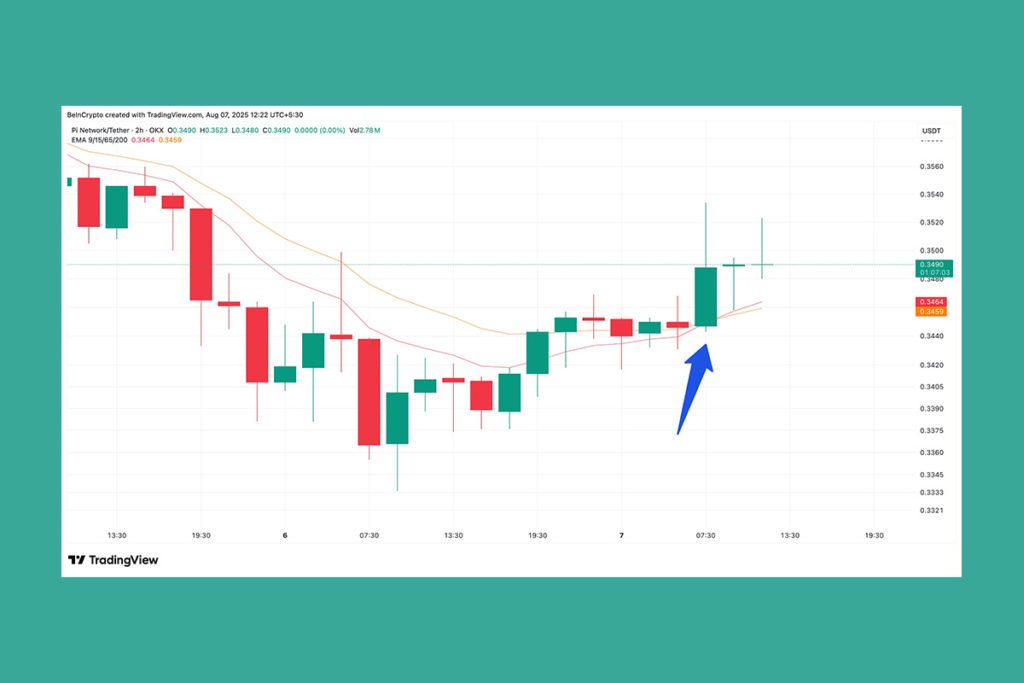
The difference between intraday highs and lows in relation to a moving average is tracked by the Bull-Bear Power index. Green bars, which are frequently a faint but early indication of accumulation, show that bulls are trying to gain control. The 4-hour chart lacked directional clarity even though it displayed the initial indications of buying pressure. Therefore, the 2-hour chart is important for capturing early trend changes and momentum increases that may become unclear over longer time frames.
On this shorter timeframe, there was merely a crossover of the 9/15-period exponential moving average (EMA). The slower 15-EMA (orange line) has been overtaken by the faster-moving 9-EMA (red line). This implies that, for the first time since August, purchasers have begun to exert influence over short-term price movement, overwhelming sellers. This crossover is a pertinent positive signal since the 9/15 EMA is frequently utilized to spot early momentum shifts before they manifest on longer timeframes.


Pi Coin Eyes Breakout as Price Presses Against Bullish Pennant
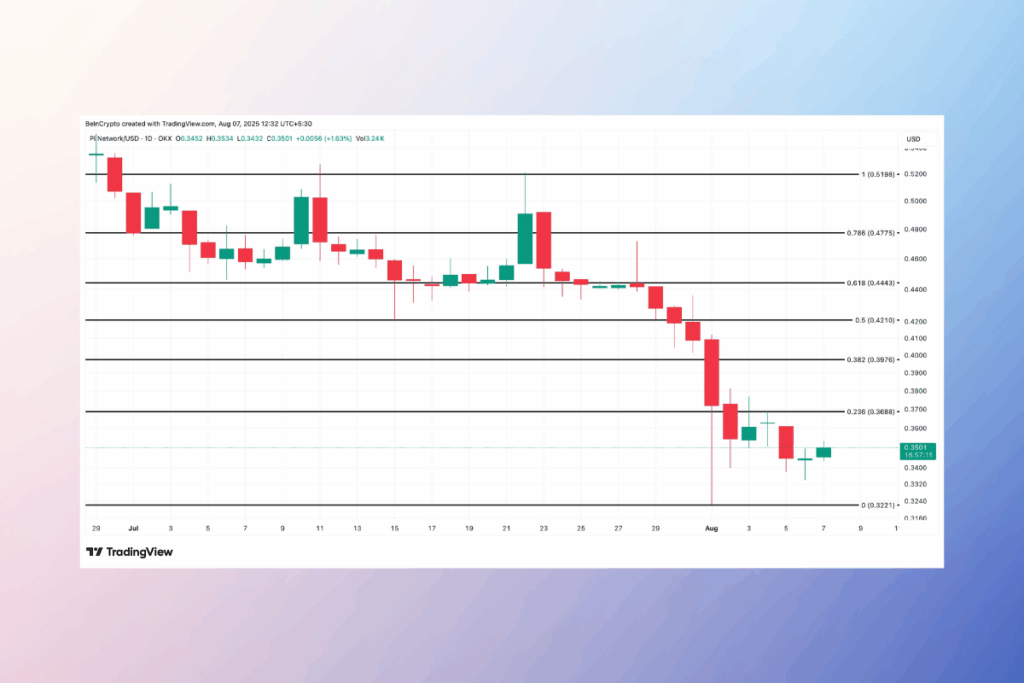
Additionally, the PI price is consolidating strongly around $0.35 on the same 2-hour chart, straining against the upper trendline of a bullish pennant. A short leg higher with short-term targets close to $0.36 might be unlocked by a clean candle close above that level. These levels are significant resistance zones, as the daily Pi Coin price chart attests. The 0.36 and $0.39 marks correspond to the highest bound of earlier rejections. The current pattern will collapse, and new lows are possible if the PI price invalidation, which is located at $0.32, breaks.
For more up-to-date crypto news, you can follow Crypto Data Space.


Comments are closed.