BTC Price – Is Bitcoin Heading Towards a Pullback? Insights and Predictions
BTC Price – Over the past 30 days, Bitcoin (BTC) has experienced a 6% increase in price. However, recent indicators suggest that the current trend strength, as measured by the Average Directional Index (ADX), is showing signs of weakening. Additionally, recent netflows of BTC into exchanges hint at a shift toward caution among holders.

To aim for a new all-time high, BTC must break above the $68,506 resistance level; failure to hold key support levels could result in a price pullback.
Current Trend Strength Indicates Caution
The current ADX for Bitcoin stands at 33.55, indicating moderate trend strength. The ADX measures the strength of a price trend, irrespective of its direction—whether up or down. Values above 20 indicate that a trend is gaining traction, while readings above 50 suggest a very strong trend.

With BTC’s ADX at 33.55, the trend is present but not overwhelmingly strong. Although BTC is in an uptrend, the trend is much weaker than when the ADX previously climbed above 50. This reduction in trend strength signals that the momentum propelling BTC higher has lost some vigor. A weakening trend could lead to less confidence in continued upward movement, increasing the likelihood of consolidation or a pullback.
Netflow Insights: A Cautious Shift
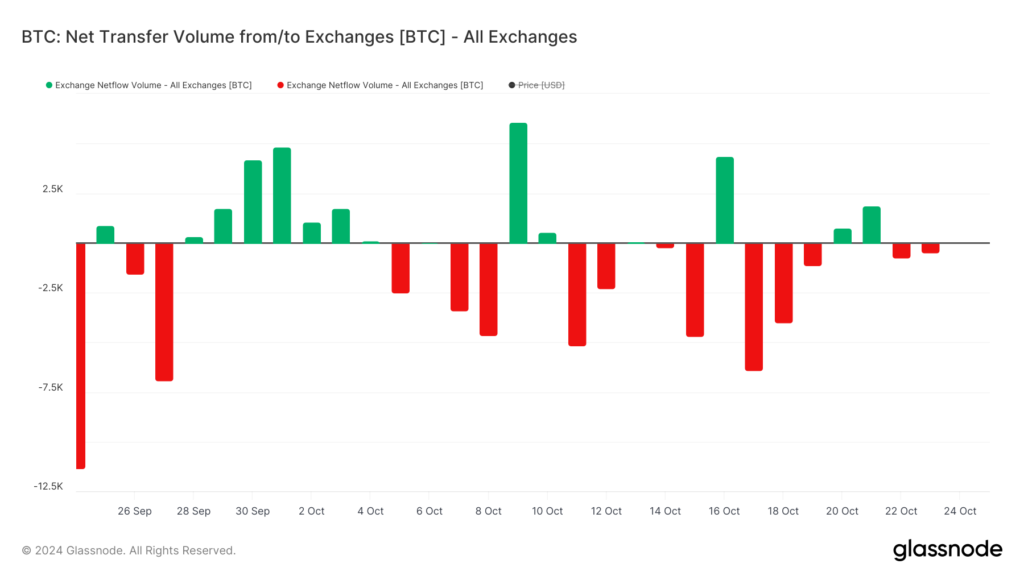
Between October 17 and October 19, BTC’s net transfer volume to exchanges reached approximately 12,000 BTC, indicating significant net inflows. Generally, when users move assets off exchanges, it is viewed as a bullish signal, suggesting they are not planning to sell.
Conversely, rising net inflows into exchanges can imply that holders are preparing to sell their BTC, potentially leading to increased selling pressure. After three days of negative netflows—where more BTC exited exchanges than entered—the trend briefly turned positive and has fluctuated in the past two days. Although recent netflows have turned negative again, the volume is significantly lower compared to the surge observed between October 17 and October 19.
This change indicates that holders may not be as confident as before, signaling a possible shift toward caution and limiting the chances for strong bullish momentum in the short term.
Bitcoin Price Prediction: Path to New All-Time High?
The BTC price chart reveals that the short-term Exponential Moving Average (EMA) lines remain above the long-term ones, which is a bullish signal. However, the gap between these EMAs has narrowed compared to previous days, indicating that bullish momentum is weakening.
If BTC can break through the resistance level at $68,506, it could rise further to $70,036, marking a new all-time high. On the downside, if the current trend reverses, BTC may retest the support level at $62,648. Should this level fail to hold, BTC might decline further, with the next significant support around $57,830.
In summary, while Bitcoin has seen a price increase recently, the weakening trend strength and shifting netflows suggest a cautious sentiment among investors. As BTC approaches critical resistance levels, market participants will be closely watching for signs of either a breakout to new highs or a potential pullback.
FAQ: Bitcoin Price Analysis
What is the current price trend for Bitcoin (BTC)?
Bitcoin has gained 6% over the last 30 days, but the trend strength, as indicated by the Average Directional Index (ADX), shows signs of weakening.
What does the ADX value of 33.55 indicate?
An ADX value of 33.55 suggests that while Bitcoin is in an uptrend, the strength of that trend is moderate, meaning it is not as strong as it has been in the past when it was above 50.
Why are recent netflows of BTC into exchanges important?
Recent netflows indicate a potential shift in sentiment among holders. Increased inflows to exchanges can imply that holders may be preparing to sell their BTC, which could lead to increased selling pressure.


Leave a comment